
📌 Key Takeaways
Capability indices promise a quick answer to supplier readiness, but only three foundational checks—measurement system analysis, process stability, and distribution shape—determine whether those numbers are actually valid.
- Cp Measures Potential, Cpk Measures Reality: Cp shows how much room exists between spec limits and process spread (the lane width), while Cpk accounts for where your mean actually sits (centered driving). A process with high Cp but low Cpk has a centering problem, not a spread problem.
- Three Gates Before Trust: Verify your gauge is capable through MSA, confirm the process is stable with control charts, and check that the distribution is approximately normal. Skip any gate, and the indices mislead rather than inform.
- Context Determines ‘Good Enough’: No universal Cpk threshold exists. Your target depends on specification risk, defect consequences, and end-use criticality—standards provide methods, not magic numbers.
- Compare Short-Term to Long-Term: When Cp/Cpk (short-term, within-subgroup) significantly exceed Pp/Ppk (long-term, overall), you’re seeing drift, seasonal effects, or shift patterns that demand tighter incoming inspection.
- Three Clear Paths Forward: Accept when all checks pass and indices meet your risk target. Question when centering lags but spread is adequate. Re-test when foundational assumptions fail—instability, poor MSA, or non-normal data without justification.
Valid capability data enables confident decisions; invalid data creates false confidence. Procurement teams, QA managers, and converting operations professionals will find the framework here, preparing them for the detailed methodology and decision criteria that follow.
Capability numbers land on your desk with supplier qualification reports, pilot run summaries, and audit findings. They promise a quick answer to a critical question: Can this mill hold the spec we need? But if you’re not a statistician, the notation can feel opaque. Cp, Cpk, Pp, Ppk—are these the same thing? When should you trust them, and when should you push back?
This guide gives you a practical framework for reading process capability indices without requiring a statistics degree. You’ll learn the core difference between Cp and Cpk, the pre-flight checks that determine whether the numbers are valid, and a simple three-option decision tree: accept, question, or re-test.
Why Converters Should Care About Cp/Cpk
Capability indices summarize how tightly a process runs against specification limits and how well-centered it is within those limits. Read correctly, Cp and Cpk guide decisions on run readiness, supplier approvals, and escalations. When a supplier claims “our Cpk is 1.67,” that’s shorthand for “our process consistently hits the target with room to spare.” But the number is only meaningful if the underlying data is stable, roughly normal, and measured with a capable gauge. Without those conditions, the index can mislead you into approving a process that’s actually drifting or masking variation.
Cp vs. Cpk: The Quick, Practical Difference

Think of Cp as the width of your lane compared to the width of your car. It tells you the potential capability if you were driving perfectly centered. Cpk, by contrast, measures how centered you’re actually driving. It accounts for where your process means sits relative to the nearest specification limit.
Cp (Process Capability): The ratio of the specification width to the process spread, typically ±3 standard deviations. Formula: Cp = (USL – LSL) / (6σ). A higher Cp means more room between the spec limits and the natural process variation.
Cpk (Process Capability Index): The minimum distance from the process mean to the nearest spec limit, divided by half the process spread. Formula: Cpk = min[(USL – μ) / (3σ), (μ – LSL) / (3σ)]. When Cpk ≈ Cp, your process is well-centered. When Cpk < Cp, investigate mean shift or drift.
A stable, centered process yields Cpk approximately equal to Cp, signaling good centering. If Cp is adequate but Cpk is low, you have a centering problem—not a spread problem. These definitions and formulas are standardized in quality literature, including the NIST/SEMATECH e-Handbook of Statistical Methods.
Before You Read Any Number: MSA, Stability, and Distribution Checks
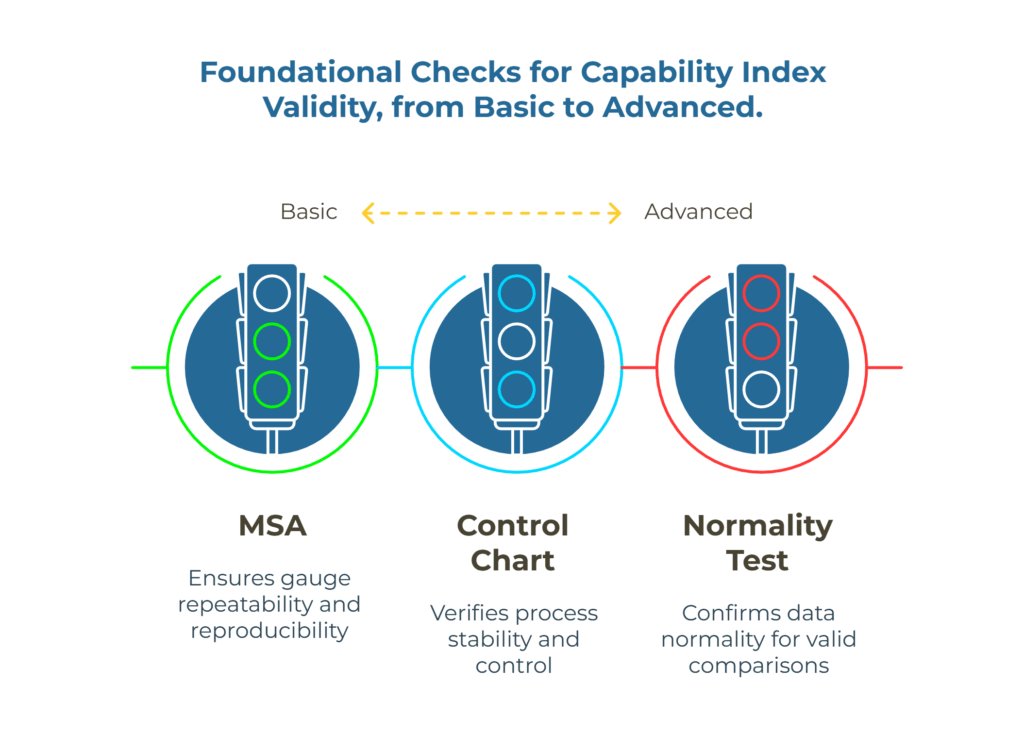
Named specs and tolerances determine which capability targets matter, but three foundational checks must pass before you interpret any index:
1. Measurement System Analysis (MSA): Is your gauge capable? If the measurement system’s repeatability and reproducibility consume a large portion of the observed variation, your capability estimate will be distorted. Measurement system error distorts capability estimates (Cp/Cpk). Request evidence that the gage R&R study shows acceptable performance—typically less than 10% of tolerance or 30% of total variation.
2. Process Stability: Run a control chart first. If the process exhibits special causes, trends, or drift, capability indices are meaningless. Capability assumes a stable process in statistical control. Foundational guidance appears in the ISO 22514 series on capability and performance, which provides standardized methods for these assessments.
3. Distribution Shape: Cp and Cpk assume an approximately normal (bell-shaped) distribution. Non-normal or drifting data invalidates naïve Cp/Cpk comparisons. If your histogram is heavily skewed or bimodal, consider data transformations such as Box-Cox or Johnson methods or alternative indices before accepting a standard capability report. Always verify normality with a probability plot or goodness-of-fit test.
Align results with method-named test standards (e.g., TAPPI specifications for paper testing) so everyone is reading the same yardstick. For guidance on setting these tolerances, see QA acceptance without debate: set method-named tolerances and attach results at quote time.
How to Read a Capability Summary
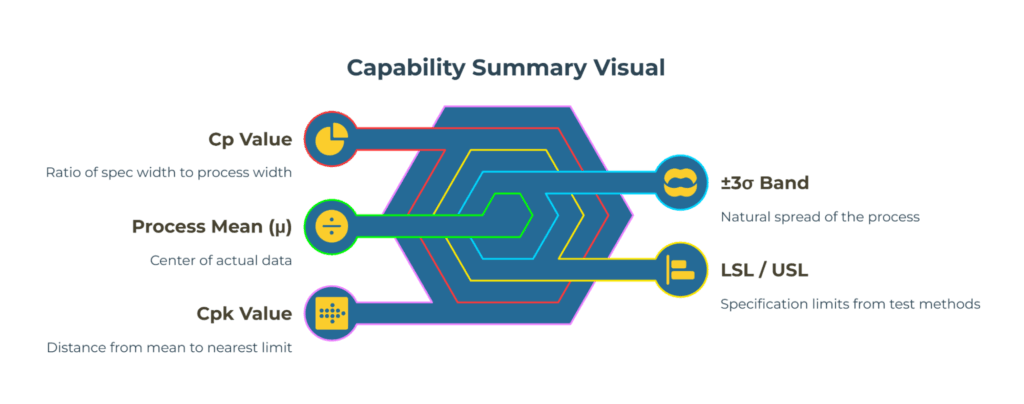
A typical capability summary presents a bell curve with the following annotations:
- LSL / USL: Lower and Upper Specification Limits, derived from your named test methods (e.g., ISO 536 for basis weight, TAPPI T 410 for moisture).
- Process Mean (μ): The center of your actual data.
- ±3σ Band: The natural spread of the process. If the process is stable and normal, roughly 99.7% of observations fall within this band.
- Cp Value: Shown as the ratio of spec width to process width.
- Cpk Value: Shown as the distance from the mean to the nearest limit, scaled by process spread.
When you see a visual where the mean is shifted toward one spec limit, Cpk will be noticeably smaller than Cp. That gap signals a centering issue. Compare short-term indices (Cp/Cpk) with long-term indices (Pp/Ppk). A large gap between them signals drift, shift, or seasonal effects—raise incoming-inspection vigilance when this pattern emerges. Request a centering correction plan before approval, or escalate for re-testing if the shift is unexplained.
For a deeper dive into reading supplier capability data, review how to interpret lab test reports for kraft paper: a procurement-friendly guide.
What ‘Good Enough’ Means Depends on Your Spec and Risk
There’s no universal threshold for an acceptable Cpk. Common industry rules of thumb suggest Cpk ≥ 1.33 for general manufacturing or Cpk ≥ 1.67 for critical processes, but these are guidelines—not mandates. Standards provide methods, not universal thresholds. The right target depends on your specification risk, the consequence of a defect, and your acceptance sampling plan.
A packaging line running kraft linerboard for corrugated boxes may tolerate a lower Cpk on caliper than on burst strength, because the functional risk differs. Tie your capability requirements to the named methods and tolerances in your RFQ, and document the rationale. The ISO 22514 series offers method guidance for these assessments; ensure alignment with your testing standards.
For structured approaches to defining pass/fail criteria, see acceptance sampling plans with kraft paper manufacturers: choosing AQL levels to minimize rejection risk.
Common Traps: Non-Normal Data, Mixed Lots, and Small Samples
Even if you’ve confirmed stability and gauge capability, three common pitfalls can make capability numbers unreliable:
Mixed Lots: Pooling data from multiple production runs or shifts hides within-lot shifts. If the supplier averaged together three days of production with different setups, the combined histogram may look stable, but individual runs could be drifting. Always ask for lot-by-lot or shift-by-shift capability summaries.
Small Samples: A capability study based on 15 data points inflates uncertainty. The standard deviation estimate is unstable, and the confidence interval around Cpk is wide. Industry practice typically requires at least 25-30 subgroups (or 100+ individual measurements, depending on subgroup size) for a reliable short-term study.
Subgrouping Choices: How you slice time or units affects the Cp and Cpk calculation. Rational subgrouping—grouping units produced under similar conditions—captures short-term, within-subgroup variation. If subgroups are defined incorrectly (e.g., mixing shifts or setups), the indices won’t reflect true process capability.
Non-Normal Data: Don’t force normal Cp/Cpk formulas on skewed or bimodal distributions. Use distribution-appropriate methods or transformations such as Box-Cox or Johnson transformations, and clearly state the approach used.
For broader context on how supplier evidence and reliability intersect with capability claims, explore kraft paper manufacturers capability matrix: compare GSM, BF/BST, moisture control, and certifications without guesswork.
Decide and Act: Trust, Question, or Re-Test
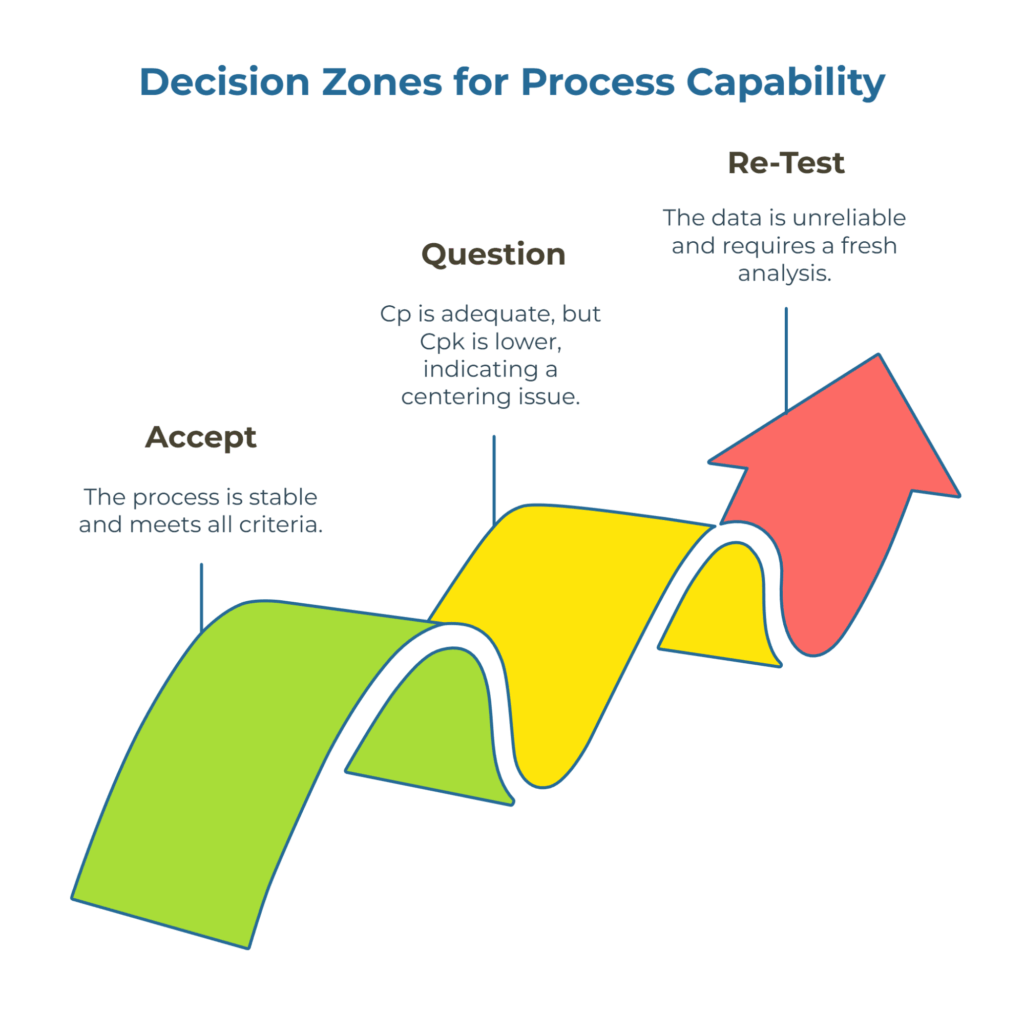
After reviewing the MSA, stability, distribution, and sample size, you’ll land in one of three decision zones:
Accept: The process is stable, distribution is approximately normal, MSA is acceptable, and Cpk ≈ Cp with both values adequate for your spec risk. Proceed with approval or production ramp-up. Document the capability baseline for future audits.
Question: Cp is adequate, but Cpk is significantly lower, indicating a centering issue. Ask the supplier for a centering correction plan with timeline and verification protocol. Alternatively, if the study meets all other criteria but the Cpk is marginally below your target, request a larger sample or a follow-up study after process adjustments.
Re-Test: The data shows instability, poor MSA, non-normal distribution without justification, or mixed-lot pooling. Reject the current study and require a fresh capability analysis after the root causes are addressed. Do not approve the supplier or run based on unreliable data.
Pocket Glossary: Cp, Cpk, Pp, Ppk, USL/LSL, Sigma, Subgrouping
Cp (Process Capability): Potential capability assuming perfect centering. Calculated as (USL – LSL) / (6σ) using short-term, within-subgroup sigma. Distrust if the process is unstable or non-normal distribution is unaddressed.
Cpk (Process Capability Index): Actual capability accounting for centering. Calculated as min[(USL – μ) / (3σ), (μ – LSL) / (3σ)] using short-term sigma. Distrust if the mean is drifting over time.
Pp / Ppk (Process Performance): Long-term analogs of Cp/Cpk. These indices use overall, long-term sigma without rational subgrouping, capturing both within-subgroup and between-subgroup variation. Distrust when short-term control changes, as Pp/Ppk may not reflect current capability.
USL / LSL (Upper/Lower Specification Limits): The tolerance boundaries defined by your named test methods (e.g., TAPPI T 403 for burst strength, ISO 287 for moisture). These limits must be explicit in your RFQ or contract.
Sigma (σ): Standard deviation estimate of process variation. The choice of estimator (e.g., R-bar/d2 for subgroup ranges vs. pooled standard deviation) and subgrouping strategy both affect the final σ value and, consequently, Cp/Cpk.
Subgrouping: The method of organizing data into rational subgroups—units produced under similar conditions within a short time window. Proper subgrouping isolates short-term, common-cause variation and is essential for meaningful Cp/Cpk interpretation.
MSA / Gage R&R: Measurement system analysis studies that confirm the measurement system’s capability so capability numbers reflect the process, not the instrument.
Frequently Asked Questions
Q: Is there a universal “good” Cpk value?
No. Targets are set by your spec, risk tolerance, and end use. Regulated or high-consequence applications often demand higher capability than commodity contexts. Standards provide methods, not one-size thresholds.
Q: What’s the difference between Cpk and Ppk?
Cpk uses short-term, within-subgroup sigma and reflects immediate process centering and spread. Ppk uses long-term, overall sigma and reflects performance over time. Look at both to detect drift or seasonal effects.
Q: What if the data are non-normal?
Don’t force normal Cp/Cpk formulas. Use non-normal models or transformations (Box-Cox, Johnson) and clearly state the method, then interpret accordingly.
Reading capability indices enables evidence-based supplier and run decisions. You don’t need a statistics degree, but you do need a disciplined framework: verify the measurement system, confirm stability, check distribution shape, and then interpret Cp and Cpk in the context of your named specifications and acceptance risk. When Cpk ≈ Cp and both meet your target, trust the data. When Cpk lags Cp, question the centering. When foundational checks fail, re-test.
Whether you’re a buyer qualifying suppliers or a supplier optimizing your process, capability indices are a shared language for managing specification risk. Use them with rigor, and they become a powerful tool for transparent, evidence-based decisions.
For Buyers: Ready to connect with verified suppliers who can demonstrate process capability? Submit your RFQ and receive quotes free or find suppliers across 195 countries on PaperIndex.
For Suppliers: Want to showcase your mill’s capability to a global buyer base? Join PaperIndex free and connect with 49,000+ buyers actively sourcing for quality-verified partners.
Learn More: Explore additional guides on quality assurance, supplier qualification, and international trading best practices at PaperIndex Academy.
Disclaimer: This article provides general information about reading process capability (Cp/Cpk). Outcomes vary with process stability, sampling method/size, distribution shape, and measurement system capability. For guidance tailored to your line and acceptance criteria, consult your QA/engineering lead.
Our Editorial Process
Our expert team uses AI tools to help organize and structure our initial drafts. Every piece is then extensively rewritten, fact-checked, and enrich
ed with first-hand insights and experiences by expert humans on our Insights Team to ensure accuracy and clarity.
About the PaperIndex Insights Team
The PaperIndex Insights Team is our dedicated engine for synthesizing complex topics into clear, helpful guides. While our content is thoroughly reviewed for clarity and accuracy, it is for informational purposes and should not replace professional advice.