
📌 Key Takeaways Match the bag to the job it actually faces—not to a heavier paper weight. Name the problem before you name the fix. Takeaway and delivery operations teams responsible for packaging procurement will gain a clear method for matching bag features to real handling conditions, preparing them for …

May 30, 2026
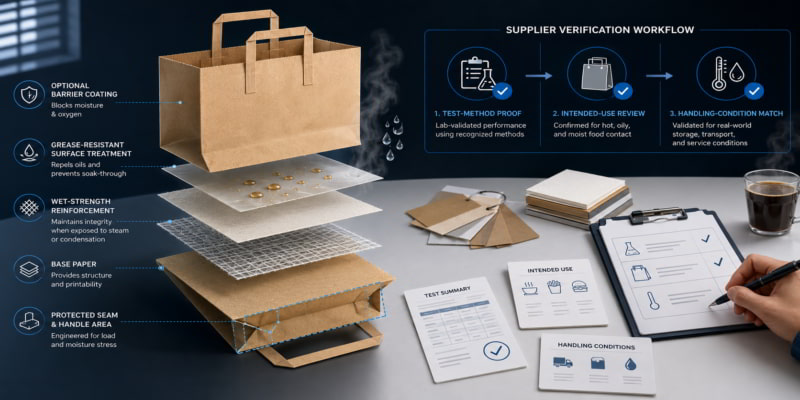
Specifying Paper Bags for Greasy, Hot, or Moisture-Prone Food Packaging Without Overengineering
📌 Key Takeaways A paper bag spec should match the food, grease, heat, and handling it actually faces — not just the label on the box. Specify for the stress, not for the shelf. Food-service buyers and packaging procurement teams sourcing paper bags will gain a practical framework for writing …

May 30, 2026
Food-Service Paper Bag Materials: What to Check for Contact Surfaces, Liners, and Coatings
📌 Key Takeaways A food-service paper bag is not one material — it is several layers, and each layer needs its own food-contact proof. One bag, many layers — approve the evidence for each one, not just the label on the outside. Food-service buyers, procurement teams, and QA managers evaluating …

May 30, 2026
Kraft, White, and Recycled Paper Bags: Specification Trade-Offs for Retail and Food Service Buyers
📌 Key Takeaways Define what the bag needs to do first then match the material, not the other way around. Specify the job, then verify the claim — assumptions cost more than samples. Procurement managers, QA leads, and packaging buyers comparing paper bag options will gain a clear method for …

May 30, 2026
How Paper Bag Material Specifications Affect Load Capacity, Shelf Handling, and Retail Use
📌 Key Takeaways A paper bag’s real strength comes from how it’s built and used, not just how heavy the paper is. The best spec matches the bag’s actual job — not the highest number on the data sheet. Procurement managers, QA leads, and packaging buyers sourcing paper bags will …

May 28, 2026
The Golden Age of Fiber: How the New EU Packaging Laws Are Changing the Game for Waste Paper Buyers
The regulatory framework governing packaging in the European Union is undergoing its most profound structural transformation in three decades. On February 11, 2025, the Packaging and Packaging Waste Regulation (PPWR) officially entered into force, establishing the structural framework to replace fragmented national rules with a directly applicable, EU-wide mandate starting …

May 28, 2026
The New Paper Trail: How EU Regulation 2025/40 (PPWR) Redefines the Waste Paper Market
A Regulatory Seismic Shift The landscape of European secondary raw material procurement is undergoing its most significant structural transformation in decades. The EU Packaging and Packaging Waste Regulation (PPWR), designated as Regulation 2025/40, entered into force with a series of critical safety and operational compliance protocols taking effect on 12 …

May 28, 2026
The Upcoming EU PPWR Compliance Deadline: Send This Email to Your Paper Packaging Suppliers Now
If your business exports goods to the European Union or operates within it, the compliance countdown is well underway. The EU’s sweeping Packaging and Packaging Waste Regulation (PPWR) is moving toward its primary application date, which takes effect 18 months following its final publication in the Official Journal of the …

May 26, 2026
Corrugated Box Storage SOPs for Packaging, Warehouse, and Quality Teams
📌 Key Takeaways Corrugated box storage works best when packaging, warehouse, and quality teams share ownership instead of leaving it all to the warehouse. Shared visibility beats shared blame. Warehouse, quality, and procurement teams managing corrugated box inventory will find a ready-to-adapt responsibility framework here, preparing them for the detailed …

May 26, 2026
Corrugated Box Storage Audit Questions for SMB Packaging and Warehouse Teams
📌 Key Takeaways Most corrugated box damage starts with missing handoffs between procurement, warehouse, and quality — not one bad decision. Shared visibility across teams catches storage problems before they reach the customer. SMB packaging buyers, warehouse leads, and quality managers will find ready-to-use audit questions and escalation frameworks here, …

May 26, 2026
A Cross-Functional SOP Framework for Corrugated Box Storage and Escalation
📌 Key Takeaways Corrugated box storage problems usually start because no one defines who owns which part of the process — not because teams lack skill. Defined roles + condition checks + a shared issue log = boxes that actually perform on the packing line. Packaging, warehouse, and quality teams …

May 26, 2026
What Packaging Buyers Should Document About Warehouse Conditions Before Reordering Corrugated Boxes
📌 Key Takeaways Most corrugated box problems trace back to what happened after delivery — and documenting warehouse conditions before reordering turns guesswork into a fact-based conversation with suppliers. Document first, decide second — a one-page warehouse record turns reactive complaints into productive supplier conversations. Procurement teams and warehouse managers …

May 26, 2026
How to Compare Standard and Moisture-Resistant Corrugated Boxes Without Overbuying
📌 Key Takeaways Choosing between standard and moisture-resistant corrugated boxes starts with documenting what your boxes actually face — not assuming “stronger” means better. Specification decisions backed by evidence prevent both overbuying and repeated damage. Procurement managers, warehouse supervisors, and quality teams evaluating corrugated packaging for humidity-sensitive storage will gain …

May 25, 2026
Supplier Questions to Ask Before Buying Corrugated Boxes for Humid Storage Conditions
📌 Key Takeaways Telling your supplier exactly what your warehouse environment looks like prevents new boxes from collapsing during humid storage. Clear and honest communication with your packaging supplier stops seasonal warehouse humidity from silently destroying your expensive containers. Procurement and warehouse managers will gain highly practical sourcing strategies here, …

May 25, 2026
Why Corrugated Boxes May Look Usable in Storage but Fail During Packing or Shipping
📌 Key Takeaways Boxes that look perfect on the shelf often fail during shipping because quiet storage hides invisible moisture and structural fatigue. Physical testing before packing stops expensive failures during shipping. Warehouse and quality teams will gain practical inspection skills here, preparing them for the detailed overview that follows. …

May 25, 2026
How Humidity Changes Corrugated Box Stack Planning in SMB Warehouses
📌 Key Takeaways High humidity slowly weakens dry-looking corrugated boxes, forcing you to adjust your stack heights, pallet quality, and storage times. Smart support and shorter storage times stop invisible humidity from quietly crushing your valuable inventory. Small business warehouse teams will learn how to protect their stock, setting up …

May 25, 2026
Corrugated Box Storage for Slow-Moving Packaging Stock in SMB Warehouses
📌 Key Takeaways Slow-moving corrugated boxes lose strength based on where they sit, not just how long they’ve been stored. Condition-aware storage beats calendar-based rotation every time. SMB warehouse managers and packaging procurement teams coordinating on storage and reorder decisions will gain a practical inspection framework here, guiding them into …

May 25, 2026
Corrugated Box Storage Zones: How Warehouse Teams Can Spot Humidity Risk Areas
📌 Key Takeaways The same warehouse can have safe zones and risky zones — and where boxes sit matters more than how dry the building feels overall. Where the box sits changes the outcome more than what the box is made of. Warehouse supervisors and quality teams managing corrugated stock …

May 25, 2026
When Corrugated Box Damage Comes From Storage, Suppliers, or Handling: A Practical Triage Guide
📌 Key Takeaways When corrugated boxes fail after delivery, matching the damage pattern to records — not gut reactions — reveals the real cause. Evidence turns difficult supplier calls into productive ones. Packaging buyers, warehouse managers, and QA teams dealing with post-delivery box failures will find a ready-to-use triage framework …

May 22, 2026
How to Check Corrugated Box Deliveries for Humidity Exposure Before Warehouse Storage
📌 Key Takeaways A simple dock checklist turns a humidity-suspect corrugated box delivery into a structured, documented decision — no lab equipment needed. Document early, separate fast, and let evidence — not assumptions — guide the next step. Warehouse teams, packaging buyers, and quality managers handling corrugated box deliveries will …