

📌 Key Takeaways
Supplier qualification failures cost you production downtime, emergency re-sourcing at premium prices, and customer complaints—avoid these risks by proving mill capability under real operating conditions before committing to volume.
- Pilot-First Reduces Both Cost and Service Risk: Structured trial runs with complete evidence chains—COA linked to retained samples linked to incoming inspection—reveal repeatability problems before they halt your converting line.
- Capability Matrices Beat Quoted Specs: Document what mills actually hold under normal production conditions (P50–P95 ranges across multiple lots) rather than accepting optimized samples that mask seasonal drift and process centering issues.
- Cpk Trumps Cp for Real-World Decisions: Process capability indices that account for centering (Cpk ≥ 1.33 for critical properties) predict supply performance better than variation-only measures, especially when mills run consistently near specification limits.
- Staged Volume Ramps with Risk-Based Monitoring: Tier your supplier progression (10-25% monthly demand for clean pilots, 5-15% for conditional passes) with enhanced inspection protocols and clear Corrective and Preventive Action (CAPA) triggers that catch quality drift before it becomes a crisis.
- Landed-Cost Normalization Reveals True Winners: Converting mixed Incoterms quotes (EXW vs. DDP) to a single to-door basis—including freight, insurance, duties, and yield factors—prevents awarding business to apparently cheaper suppliers who become expensive after logistics reality hits.
Verified capability under operating conditions beats supplier promises every time.
Containerboard buyers managing converting operations and supply chain risk will find a systematic qualification framework here, preparing them for the detailed pilot protocols, capability assessment tools, and commercial integration steps that follow.
Supplier qualification isn’t a formality—it’s the difference between a stable supply chain and costly disruptions. When you’re sourcing containerboard, the stakes are high: one bad reel can halt your converting line, trigger customer complaints, and force emergency re-sourcing at premium prices. The traditional approach of relying on supplier promises and generic mill certifications leaves too much to chance.
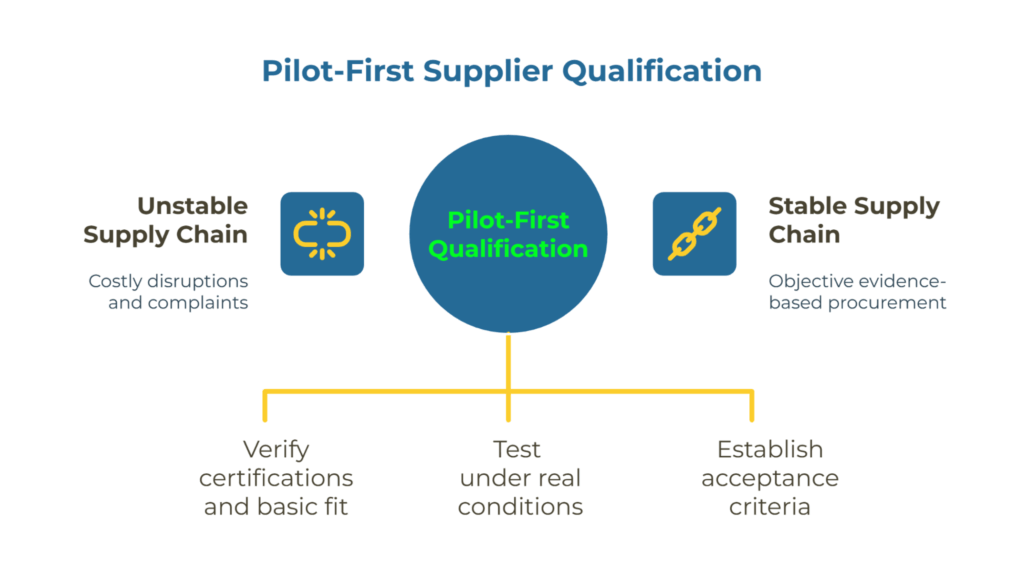
This playbook introduces a pilot-first qualification framework that proves mill capability under real operating conditions before you commit to large-volume purchases. You’ll learn how to audit pre-pilot evidence, structure a meaningful trial, interpret capability data without getting lost in statistical formulas, and establish acceptance criteria that protect your operations. By the end, you’ll have a defensible process that aligns your procurement, quality assurance, and operations teams around objective evidence.
The goal is simple: demonstrate that a mill can repeatedly deliver a containerboard that meets your specifications when it matters most—on your converting line, at production speed, under typical handling and storage conditions.
What Qualification Means (and Why Pilot-First)
Qualification verifies that a mill can repeatedly hit your specifications under operating conditions. The relationship is straightforward: repeatability matters more than one-time performance. A mill might produce excellent samples in ideal conditions, but the real test comes during continuous production runs when dealing with variations in fiber supply, machine conditions, and seasonal humidity changes.
Why does this matter? Unplanned downtime and specification drift create both cost and service risk. When containerboard arrives off-spec or performs inconsistently on your converting line, you face immediate operational problems—production delays, increased waste, customer complaints—and longer-term strategic concerns about supply chain reliability.
The pilot-first approach reduces both types of risk by building evidence through a structured sequence: run a scoped pilot trial, capture the complete evidence chain (Certificate of Analysis linked to retained samples linked to incoming inspection results), evaluate performance against pre-defined acceptance criteria, then ramp volumes with appropriate controls based on demonstrated capability.
This method flips the traditional sourcing sequence. Instead of awarding business based on promises and discovering problems during production, you verify capability in controlled conditions before committing to large volumes. The pilot provides three essential forms of evidence: repeatability across a production run, performance under your actual conditions, and documented capability that becomes the foundation for ongoing supplier management.
For more context on systematic supplier evaluation approaches, explore the resources available through PaperIndex Academy.
The Minimum Pre-Pilot Evidence (Certifications and Basic Fit)
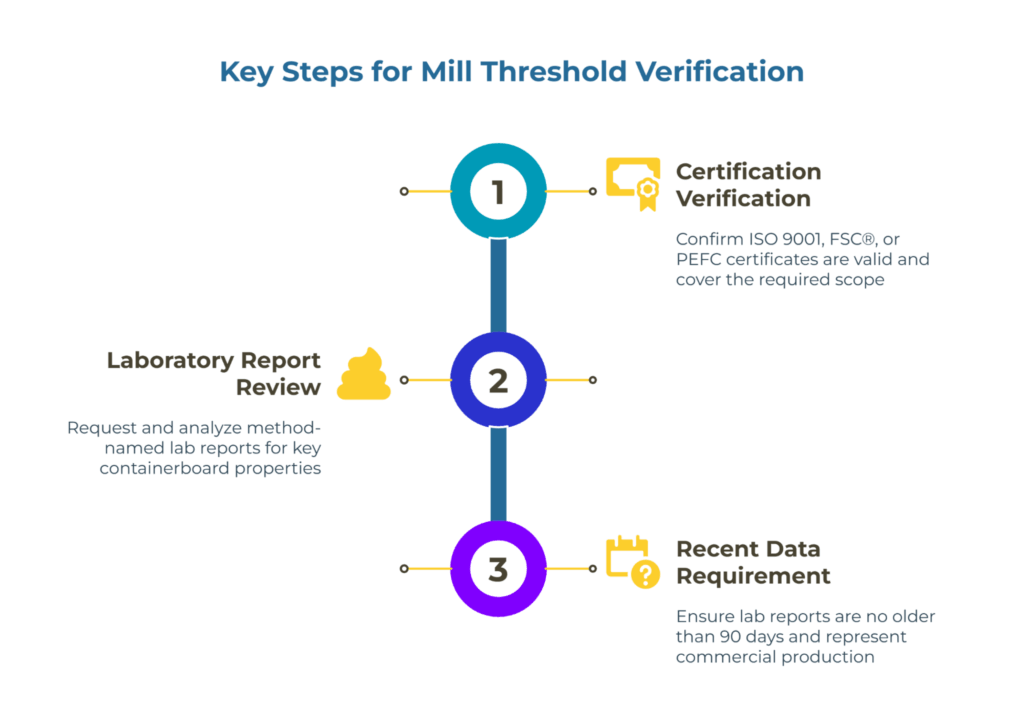
Before investing time and resources in a pilot trial, verify that a mill meets basic threshold requirements. This preliminary audit prevents wasted effort on suppliers who lack fundamental capabilities.
Start with certification verification. ISO 9001 is the globally recognized standard for quality management systems, demonstrating a mill’s ability to consistently provide products that meet customer and regulatory requirements. The certificate alone doesn’t tell the complete story—you need to verify three specific elements: the certification scope covers the containerboard grades you’re purchasing, the certificate is current and issued by an accredited body, and the scope explicitly includes the manufacturing facility that will supply your material, not just a corporate headquarters or sister plant.
For packaging applications requiring chain-of-custody documentation, verify FSC® (Forest Stewardship Council) or PEFC (Programme for the Endorsement of Forest Certification) credentials. FSC® certification indicates products come from responsibly managed forests, with its Chain of Custody standard tracking certified material through the supply chain. PEFC certification serves as another widely recognized scheme promoting sustainable forest management with traceable supply chains. Check that the mill’s certificate number is active through the respective online registries, the scope includes the specific grade families you need, and the entity name matches the legal business name on your procurement documents.
Beyond certifications, request method-named laboratory reports for the specific grades under consideration. “Method-named” means the mill identifies the exact test standard used for each property—ISO 536 for basis weight, TAPPI T 403 for burst strength, ISO 9895 for short-span compression test, for example. Generic property names like “burst” or “strength” without method identification create ambiguity because different test procedures yield different results.
These reports should be recent (within 90 days) and represent commercial production, not research samples. The data should show a realistic range of results across multiple production lots, not a single optimized data point. If a mill provides only perfect numbers with no variation, that’s a warning sign—all manufacturing processes have natural variation, and you need to understand the typical range you’ll encounter.
For detailed guidance on interpreting these certifications and ensuring scope validity, see our comprehensive guide on certification verification: FSC/ISO scope and validity. To understand how to read and validate the technical content in laboratory reports, consult our resource on how to read test-method-named lab reports.
This pre-pilot audit serves as a gate. Mills that can’t produce valid certifications and method-named laboratory data shouldn’t proceed to pilot trials. It’s more efficient to disqualify suppliers at this stage than to discover fundamental capability gaps during expensive trial runs.
Build the Mill Capability Matrix (What They Can Actually Hold)

A capability matrix is a practical tool that documents the range a mill can hold on key specifications under real operating conditions. It’s not a wish list of what they’d like to achieve—it’s a factual record of demonstrated performance compiled from pilot trials and ongoing commercial production data.
The distinction matters. Many mills provide target specifications that represent ideal conditions: perfect fiber quality, optimal machine settings, experienced operators on shift, and favorable ambient conditions. These targets might be achievable occasionally, but they don’t reflect the variation you’ll see in actual shipments when fiber quality fluctuates, newer operators are on shift, or the mill is pushing production volumes to meet seasonal demand.
Your capability matrix should capture realistic operating windows for the properties that directly affect your converting performance. For containerboard buyers, this typically includes basis weight range (minimum and maximum the mill has demonstrated, not just the nominal target), moisture content range (critical for dimensional stability and adhesion), burst strength or edge crush test values showing the typical range, caliper uniformity across the web width, and surface characteristics relevant to printing or coating operations if applicable.
Here’s what a working capability matrix looks like in practice, populated with actual pilot and commercial data:
| Property (Method) | Spec Window | Mill Evidence (P50–P95) | Notes / Risks |
| Basis Weight (ISO 536) | 125–135 g/m² | 128–133 g/m² | Stable; slightly heavier at edges |
| Moisture (TAPPI T 412) | 6.0–7.5% | 6.4–7.1% | Slight drift post-monsoon season |
| ECT Equivalent | Target per grade | Meets target on pilot | Confirm at speed on B-flute |
| Caliper Profile (CD/MD) | ≤ ±1.0% | ±0.8–0.9% | Within tolerance |
This example shows how to document demonstrated capability ranges using percentile bands (P50 to P95, representing median to 95th percentile performance) rather than absolute guarantees. The notes column captures operational realities—seasonal moisture variations, cross-direction profile tendencies, conditions requiring verification.
Build this matrix progressively. The initial version uses data from your pilot trial. As the supplier delivers commercial orders, you update the matrix with actual performance data from your incoming inspection results and Certificate of Analysis documents. Over six to twelve months, you develop a reliable picture of what this mill actually delivers under normal production conditions.
This approach prevents a common sourcing mistake: awarding business based on quoted specifications, then discovering the mill consistently runs at the low end of the tolerance band. If you need edge crush test values averaging 32 lb/in for your box designs, and the mill’s actual capability centers around 30-31 lb/in even though they quote “28-34 lb/in,” you’ll face downstream problems with box performance and customer complaints.
The matrix also becomes your reference point for constructive supplier conversations. When a shipment arrives off-spec, you can ask: “Your capability matrix shows you typically hold moisture between 6.4-7.1%. This lot came in at 8.2%. What changed in your process?” This data-driven approach is more productive than vague complaints about quality issues.
For a deeper explanation of how to structure and use capability matrices in supplier evaluation, review our manufacturer capability matrix explainer.
Blank Capability Matrix Template
Use this structure to document demonstrated mill performance. Update it as you accumulate evidence from pilots and commercial deliveries. Show metric units first (g/m², kN/m) with imperial conversions in parentheses where relevant (lb/1000 ft², lbf/in).
| Property | Test Method | Target Spec | Demonstrated Range | Notes |
| Basis Weight | ISO 536 | [value ± tolerance] | [P50–P95 range] | [Observations] |
| Moisture (%) | TAPPI T 412 | [min-max range] | [Actual range] | [Seasonal notes] |
| ECT | TAPPI T 811 | [minimum] | [Typical range] | [Conditions] |
| Burst | ISO 2758 | [minimum] | [Typical range] | [Correlation notes] |
| Caliper | ISO 534 | [value ± tolerance] | [CD/MD profile] | [Uniformity notes] |
This template is deliberately simple. The goal is documentation you’ll actually maintain, not an elaborate spreadsheet that gets abandoned after the first month. Add rows for properties specific to your application (printability, water resistance, compression strength), but resist the temptation to track every possible parameter. Focus on the characteristics that genuinely affect your converting operations and box performance.
Plan the Pilot: Samples, COAs, and Incoming Inspection

A well-structured pilot creates a traceable evidence chain connecting the mill’s production data to your actual converting experience. This chain has three links: the Certificate of Analysis (COA) that documents what the mill produced, the retained samples that provide physical evidence, and your incoming inspection that verifies both.
The Certificate of Analysis is the mill’s official record for a specific production lot. It should include the production date, reel or lot identification numbers, test results for all critical properties with method references, and the signature or stamp of the mill’s quality manager. Crucially, the COA should reference the same test methods you specified in your purchase order. If you require TAPPI T 811 for edge crush testing but the COA reports a different method, you can’t make valid comparisons.
Retained samples create accountability. Before the pilot material ships, the mill should retain cross-direction samples from representative locations in the production run—typically beginning, middle, and end of the run, plus samples from both edges and the center of the web. These samples stay in the mill’s archive, ideally for 12-24 months. If a dispute arises about specification conformance, you can request independent third-party testing of these retained samples to verify what was actually produced.
Your incoming inspection completes the chain. When pilot material arrives, perform verification testing that replicates the key tests from the COA. The goal isn’t to duplicate every single data point—that’s prohibitively expensive—but to confirm the material’s condition after shipping and any storage period. Moisture content deserves special attention because it changes during transit and storage, affecting dimensional stability and adhesion properties. Use TAPPI T 412 or an equivalent recognized method for moisture determination, and record method identifications in your log.
For box and board strength verification, conduct edge crush testing (ECT measures the edgewise compressive strength of corrugated board and correlates to stacking strength, typically via TAPPI short column method) and box compression testing where applicable (BCT measures the compressive resistance of finished boxes, often via ASTM D642).
The evidence chain looks like this in practice:
Mill production: Produces pilot reels → Tests samples → Issues COA with results → Retains physical samples
Your receiving: Unpack pilot material → Condition in your environment for 24-48 hours → Perform incoming inspection → Compare your results to COA
Discrepancy resolution: If incoming results differ significantly from COA values → Review test methods for consistency → Check environmental conditions (moisture changes are normal) → If major discrepancy persists → Request third-party testing of retained samples
This systematic approach prevents the common scenario where converting problems emerge but no one can determine whether the issue originated at the mill, developed during shipping, or resulted from improper storage at your facility.
For practical guidance on moving from preliminary qualification through to this first trial order stage, see from PQQ to first controlled trial order.
Evidence Chain Checklist
Use this checklist to ensure complete traceability from mill production through your converting operations:
Pre-Shipment (Mill Responsibility)
- [ ] COA issued with complete test results and method references
- [ ] Cross-direction samples retained from beginning, middle, and end of run
- [ ] Edge samples retained from both sides of web
- [ ] All samples labeled with production date, lot number, and reel numbers
- [ ] Sample retention period committed in writing (12-24 months recommended)
At Receiving (Your Responsibility)
- [ ] Pilot material identified and segregated from production inventory
- [ ] Visual inspection for physical damage during shipping completed
- [ ] Material conditioned in your facility environment (minimum 24-48 hours)
- [ ] Incoming inspection performed using same test methods as COA
- [ ] Results documented with date, operator name, and equipment calibration status
- [ ] Discrepancies from COA values noted and communicated to mill within 48 hours
For Converting Trial (Joint Responsibility)
- [ ] Converting parameters recorded (line speed, tension, temperature, humidity)
- [ ] Any adjustments from standard settings documented
- [ ] Sample boxes or finished products retained for performance testing
- [ ] Run efficiency metrics captured (waste percentage, downtime, speed reductions)
- [ ] Operator feedback collected on runnability and handling characteristics
This checklist ensures that when you evaluate pilot results, you have the documentation to distinguish between mill capability issues, shipping or storage problems, and converting process factors.
Acceptance Criteria for Containerboard Pilots: What “Pass” Looks Like
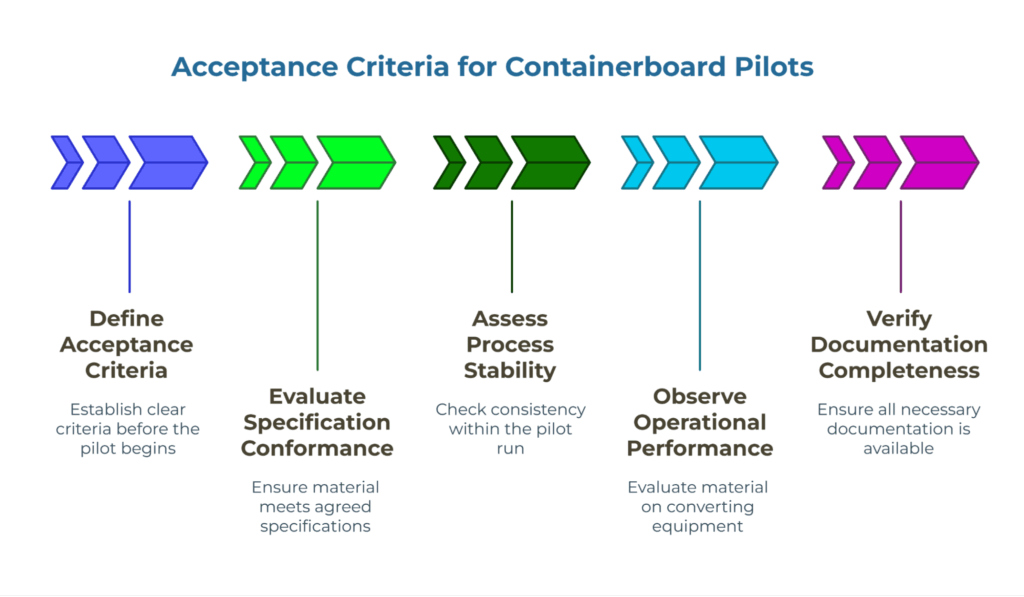
Clear acceptance criteria transform pilot evaluation from subjective judgment into objective assessment. Before the pilot begins, document exactly what constitutes a successful trial.
Effective acceptance criteria address four dimensions: specification conformance, process stability, operational performance, and documentation completeness.
Specification conformance is the baseline requirement. The pilot material must meet the agreed specifications for critical properties like basis weight, moisture content, strength characteristics (ECT, burst, or tensile as relevant to your application), and caliper uniformity. However, meeting specifications isn’t a single-point determination—you need to evaluate the distribution of results across the pilot lot. If the specification calls for moisture between 6-8% and every reel tests at 7.9%, that technically conforms but suggests the mill is operating at the edge of their control window. You want to see results distributed across the specification range with a central tendency near the target, indicating the mill has a comfortable process control margin.
Process stability evaluates consistency within the pilot run itself. Test results from the first reels should align reasonably well with results from the final reels. Significant drift—for example, basis weight starting at 123 g/m² and ending at 129 g/m² when the target is 125 ± 3—indicates process control problems that will worsen during longer commercial runs. Similarly, moisture content should remain stable throughout the run, adjusting only for documented changes in mill environmental conditions.
Operational performance captures how the material actually runs on your converting equipment. This is where many pilot programs fail: they focus exclusively on laboratory test results and neglect the practical converting experience. Your acceptance criteria should include observations about reel unwinding characteristics (edge quality, telescoping, core slippage), machine runnability (speed achieved compared to standard production rates, splice performance, frequency of breaks or adjustments), and finished product quality (print registration if applicable, box compression performance, consistency of flute formation for corrugated applications).
Documentation completeness verifies the evidence chain discussed in the previous section. A pilot that performs beautifully but lacks proper documentation creates future problems because you can’t reference baseline data when evaluating commercial shipments or investigating quality issues.
A practical acceptance framework uses a tiered system:
Pass: All critical specifications met, process shows good stability (results centered near target with normal variation), converting runs at or near standard production speeds with minimal adjustments, complete documentation package provided.
Conditional Pass: Specifications met but stability concerns noted (results at spec edges or showing drift), converting achieves acceptable production rates but requires operator attention, documentation complete but minor gaps exist. This tier triggers a follow-up pilot before full qualification or requires enhanced monitoring during initial commercial orders.
Fail: Any critical specification missed, significant process instability observed, converting performance unacceptable (frequent breaks, slow speeds, high waste), documentation incomplete or evidence chain broken.
Most pilots fall into the conditional pass category. Perfect performance is rare because you’re testing a new supplier relationship and production parameters. The key is documenting specific concerns and establishing improvement plans or enhanced monitoring protocols before scaling up to commercial volumes.
Pilot Acceptance Checklist
Use this single-page checklist for consistent pilot evaluation across different mills and grades:
Property Conformance (Go/No-Go)
- [ ] Basis weight: All reels within specified range, average near target
- [ ] Moisture content: All reels within specified range, no systematic drift through run
- [ ] Primary strength property (ECT/Burst/Tensile): Meets minimum requirement with margin
- [ ] Caliper uniformity: Cross-direction variation acceptable for your converting equipment
- [ ] Surface characteristics: Suitable for your printing or coating requirements (if applicable)
Process Stability Assessment
- [ ] Property variation beginning-to-end of run: Normal process variation only
- [ ] Moisture stability: ≤ 0.5% variation through run (excluding documented ambient changes)
- [ ] No systematic trends indicating process control problems
- [ ] Mill-reported process upsets or adjustments: None during pilot production
Converting Performance Evaluation
- [ ] Unwind performance: Normal edge quality, no excessive telescoping or core issues
- [ ] Run speed achieved: ≥ 85% of standard production rate for your equipment
- [ ] Splice performance: Failures ≤ 2% of total splices
- [ ] Operator adjustments required: Minimal and typical for new material changeover
- [ ] Waste generation: ≤ 3% above your standard baseline
- [ ] Finished product quality: Meets customer specifications without special accommodations
Documentation & Traceability
- [ ] Complete COA with method-named results for all critical properties
- [ ] Retained samples documented at mill with confirmed retention period
- [ ] Your incoming inspection completed and results recorded
- [ ] Converting parameters and observations documented
- [ ] Sample finished products retained for reference
Overall Pilot Decision
- [ ] Pass – Proceed to commercial qualification with standard monitoring
- [ ] Conditional Pass – Proceed with enhanced monitoring; specific concerns documented
- [ ] Fail – Do not proceed; fundamental issues require resolution before re-trial
Specific Concerns or Follow-Up Requirements: [Document any items requiring attention, additional testing, or enhanced monitoring]
This checklist provides a consistent framework while allowing you to capture pilot-specific observations and concerns that inform your ongoing supplier management approach.
Interpreting Capability (Cp/Cpk) Without the Math Headache
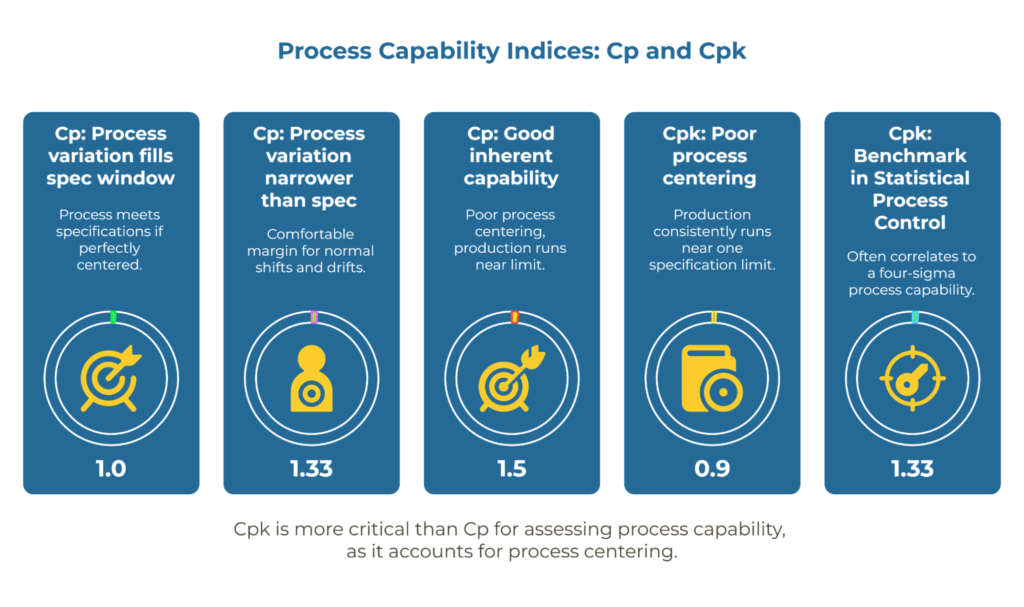
Process capability indices—specifically Cp and Cpk—appear frequently in supplier quality discussions. Understanding what they mean in practical terms helps you evaluate mill capability without getting lost in statistical formulas.
Cp measures potential process capability, comparing the specification width (upper limit minus lower limit) to the natural process variation (typically six standard deviations). A Cp of 1.0 means the process variation exactly fills the specification window—if the process is perfectly centered, nearly all production will meet specifications. A Cp of 1.33 indicates the process variation is narrower than the spec window, providing comfortable margin for normal shifts and drifts. Values below 1.0 suggest the process can’t reliably meet specifications even under ideal conditions.
Cpk adds the critical element that Cp ignores: process centering. A mill might have excellent process control (low variation) but run consistently off-center within the specification range. Cpk measures the distance from the process average to the nearest specification limit, expressed in units of process variation. If Cpk equals Cp, the process is centered. If Cpk is significantly lower than Cp, the process is running off-center.
For containerboard qualification, focus on Cpk rather than Cp. A mill with Cp of 1.5 and Cpk of 0.9 has good inherent capability but poor process centering—their production consistently runs near one specification limit. This creates risk because any additional process drift will push material out of specification.
A Cpk value of 1.33 is widely adopted as a benchmark in Statistical Process Control, often correlating to a four-sigma process capability. Many organizations use this threshold to designate a process as “capable,” though specific requirements can vary by application and industry. For authoritative background on these indices and their interpretation, the American Society for Quality’s overview of Cp/Cpk provides detailed explanation of the statistical foundations and practical applications.
Practical interpretation guidelines:
Cpk ≥ 1.33: Excellent capability with comfortable margin. The mill can maintain specifications even with normal process variation and minor centering shifts. This is your target for critical properties like edge crush test or burst strength that directly affect box performance.
Cpk = 1.0-1.33: Adequate capability but limited margin. The mill meets specifications but has little room for process drift. Acceptable for less critical properties or as a starting point for new suppliers if they demonstrate improvement plans.
Cpk < 1.0: Inadequate capability. The process can’t reliably meet specifications. Either the specification needs revision (if it’s unreasonably tight for the application) or the mill needs process improvement before you proceed with qualification.
These indices work best when calculated from real production data across multiple lots or production runs, not from a handful of optimized samples. During pilot evaluation, you might see artificially good capability numbers because the mill gives the pilot special attention. True capability emerges over months of commercial production when the pilot’s “halo effect” fades and you see typical manufacturing variation.
Don’t get trapped in paralysis by analysis. Capability indices are tools for comparing mills and tracking improvement trends, not absolute requirements. A mill with slightly lower Cpk but excellent documentation, responsive technical support, and proven ability to resolve issues quickly may be a better long-term partner than a mill with perfect statistical capability but poor communication and customer service.
The practical value comes from trends. If a mill’s Cpk for moisture control starts at 1.4 during qualification and drifts down to 0.9 over six months of commercial production, that’s a red flag requiring investigation and corrective action. The numbers tell you something changed—maybe fiber supply shifted, equipment maintenance lapsed, or operator training declined. That conversation is more productive than waiting until moisture problems cause converting failures.
Ramp Plan After a Clean Pilot: Volumes, Monitoring, and CAPA Hooks
A successful pilot proves the mill can deliver acceptable material under controlled conditions. Scaling to commercial volumes introduces new risks: larger production runs expose different aspects of process capability, increased volume can stress mill capacity and quality systems, and the pilot’s special attention often doesn’t carry forward to routine production.
A structured ramp plan manages this transition by increasing purchase volumes gradually while maintaining enhanced oversight until the supplier proves sustained capability. The plan should be risk-tiered based on pilot performance, with different volume progressions and monitoring intensities for different risk levels.
Tier A (Low Risk): Clean pass on pilot with tight capability indices and similar fiber mix or seasonal conditions to your ongoing requirements.
- Initial volumes: 10-25% of monthly demand for 1-2 production cycles
- Monitoring intensity: Every lot moisture check via TAPPI T 412, weekly edge crush test verification, monthly caliper profile review
- Progression trigger: Two consecutive clean cycles with no specification excursions
Tier B (Moderate Risk): Pass with minor deviations noted, or concerns about seasonal sensitivities or process centering.
- Initial volumes: 5-15% of monthly demand for 2-3 production cycles
- Monitoring intensity: Every lot moisture plus targeted board strength tests, on-site audit within first 60 days
- Progression trigger: Three consecutive cycles demonstrating improvement trend on flagged properties
Tier C (High Risk): Conditional pass requiring retest, or unresolved CAPA items from pilot evaluation.
- Initial volumes: 0-10% of monthly demand until CAPA verified effective
- Monitoring intensity: 100% lot-by-lot inspection of all critical properties, management review before any volume step-up
- Progression trigger: CAPA closure verified through audit evidence, minimum two cycles of full conformance
The staging approach serves two purposes. First, it limits your exposure if quality problems emerge—you haven’t committed your entire supply chain to an unproven source. Second, it gives the mill time to scale their internal processes and resources to your volume level. A mill that performs excellently on occasional 20-ton orders might struggle with the logistics, inventory management, and scheduling demands of consistent 100-ton monthly orders.
Develop clear triggers for escalation and Corrective and Preventive Action (CAPA). Common triggers include repeated out-of-specification moisture readings, systematic caliper profile drift, edge crush test or box compression test failures, or persistent runnability issues on your converting line. When triggers activate, implement immediate containment (hold suspect lots), conduct root cause analysis, and require documented CAPA with assigned owners and due dates. ISO 9001 emphasizes corrective action and continual improvement as core quality system requirements—leverage your supplier’s existing system artifacts as evidence during reviews rather than creating parallel documentation.
Periodic audits complement ongoing monitoring. Schedule an on-site audit 60-90 days into the commercial relationship to verify the mill maintains the systems, processes, and quality standards they demonstrated during qualification. This audit examines their calibration records, training documentation, retained sample systems, and how they handle internal quality issues. The goal isn’t finding perfection but confirming the mill has functional quality management that will sustain long-term performance.
For comprehensive frameworks on structuring these ongoing oversight programs, review our guide on audit and compliance framework. For detailed guidance on building and managing supplier CAPA systems, see designing supplier CAPA workflows.
The ramp plan shouldn’t feel adversarial. Frame it to the mill as mutual risk management: you’re protecting your operations while giving them a structured pathway to earn larger business. Most capable suppliers appreciate the clarity because they understand the logic and know that successful performance leads to volume growth.
From Pilot to Award: Commercial Housekeeping
After pilot acceptance, several commercial elements require attention before finalizing supplier agreements.
First, normalize landed-cost comparisons across mills using the same delivery basis. If Mill A quotes EXW (Ex Works) and Mill B quotes DDP (Delivered Duty Paid), the apparent price difference might simply reflect who’s handling freight and import duties rather than actual material cost. Converting all quotes to the same Incoterm—typically your receiving location—enables valid comparison. This normalization requires understanding what each Incoterm includes: freight charges, insurance, export and import customs clearance, duties and taxes, and unloading costs.
Use the Incoterms® definitions published by the International Chamber of Commerce to ensure consistent interpretation. These standards are revised periodically (typically every 10 years), so verify you’re referencing the current edition—as of this writing, Incoterms® 2020 represents the latest version. This standardization is particularly important when sourcing internationally, where different parties may have varying assumptions about responsibility transfer points and cost allocation.
This educational guidance helps you make informed comparisons. PaperIndex doesn’t provide market intelligence, pricing indices, or specific cost recommendations—those decisions remain between you and your suppliers through direct negotiation.
Second, establish clear payment terms and credit arrangements. New supplier relationships often require more conservative payment terms than established partnerships. Letter of credit, documents against payment, or shorter payment periods reduce risk during the initial qualification phase. As the supplier demonstrates consistent performance, you can negotiate more favorable terms that improve both parties’ working capital positions.
Third, formalize the quality agreement that governs ongoing supply. This document should reference the capability matrix developed during qualification, specify acceptance criteria based on pilot learnings, define the inspection and testing protocols both parties will follow, establish dispute resolution procedures including third-party testing rights, and document CAPA requirements and escalation processes.
Fourth, clarify logistics and inventory management expectations. Will you maintain buffer inventory for this new supplier during the ramp phase? What lead times does the mill need for different order quantities? How do you handle expedited orders or schedule changes? Clear logistics agreements prevent misunderstandings that damage otherwise solid supplier relationships.
Finally, review the complete qualification package one more time. Have you documented the entire evaluation process in a way that others in your organization can understand the supplier approval rationale? Six months from now, when someone questions why you’re using this mill, can you point to objective evidence that justified the decision? Twelve months from now, when the mill’s performance has evolved, can you compare current capability to the baseline you established during qualification?
This documentation serves multiple purposes: it provides institutional knowledge if personnel change, it offers legal protection if disputes arise, and it creates a performance baseline for evaluating supplier improvement or degradation over time.
When you’re ready to expand your supplier base or explore alternative sources, you can find containerboard suppliers on PaperIndex. The platform provides access to mills and trading companies worldwide, allowing you to apply this qualification framework to new potential suppliers. For specific containerboard grades, explore our directories for kraft linerboard suppliers and fluting/corrugating medium suppliers.
Alternatively, if you have specific requirements and want suppliers to come to you, post an RFQ free of charge to receive quotes from qualified suppliers in our network.
Appendix: Templates and Checklists
This section consolidates the practical tools introduced throughout this playbook. Download or copy these templates to standardize your qualification process across different mills and grades.
Spec Sheet Template (Minimum Fields with Version Control)
Maintain a controlled specification document for each containerboard grade you purchase. Version control prevents confusion when specifications evolve.
Document Header
- Spec Sheet ID: [Unique identifier]
- Containerboard Grade: [Linerboard/Medium, Virgin/Recycled]
- Version: [Number] | Date: [ISO format] | Author: [Name]
- Supersedes: [Previous version number]
- Approved by: [Procurement] | [Quality] | [Operations]
Physical Properties
- Basis Weight: [value ± tolerance] [g/m²] | Test Method: ISO 536
- Caliper: [value ± tolerance] [μm] | Test Method: ISO 534
- Moisture Content: [min-max range] [%] | Test Method: TAPPI T 412
Strength Properties (specify only those critical to your application)
- ECT (Edge Crush Test): [minimum] [lb/in or kN/m] | Test Method: TAPPI T 811
- Burst Strength: [minimum] [kPa] | Test Method: ISO 2758
- Tensile Strength MD/CD: [minimum] [kN/m] | Test Method: ISO 1924
Runnability Requirements
- Edge quality: [describe acceptable condition]
- Splice construction: [tape/overlap specifications]
- Core type and dimensions: [inner diameter, material]
Environmental Conditions
- Storage conditions: [temperature and humidity ranges]
- Conditioning period before converting: [hours]
Compliance Requirements
- Certifications required: [ISO 9001, FSC, PEFC, food contact, etc.]
- Restricted substances: [list any applicable REACH or similar requirements]
Documentation Requirements
- COA required: Yes | Test methods must match specification
- Retained samples: Required for [duration]
- Traceability: Lot/reel identification on all packaging
Revision History
- Version 1.0 | [Date] | Initial specification | [Author]
- Version 1.1 | [Date] | Moisture range adjusted based on pilot results | [Author]
Version control is critical. When you update specifications based on experience, converting equipment changes, or supplier capability, document what changed and why. This history prevents reverting to outdated requirements and helps onboard new team members.
Frequently Asked Questions
What minimum certifications should a containerboard mill have before a pilot?
ISO 9001 certification is the foundational requirement—it’s the globally recognized standard for quality management systems that demonstrates a mill’s ability to consistently meet customer and regulatory requirements. Verifying this certificate is a common and highly recommended first step in supplier qualification. Beyond ISO 9001, packaging applications requiring chain-of-custody documentation need FSC® or PEFC certification, which you can verify through the respective online registries. Food-contact applications may require additional certifications depending on your regulatory requirements and target markets. The key is verifying that certification scope explicitly covers the containerboard grades and production facility you’re evaluating, not just corporate headquarters.
How do COAs relate to what my converting line actually runs?
Certificates of Analysis document the material condition at the mill immediately after production. Your converting experience depends on that baseline quality plus everything that happens afterward: moisture changes during shipping and storage, physical handling that affects edge quality or causes core damage, and the time lag between production and use. Treat COAs, retained samples, and incoming inspection results as a single evidence chain—the COA proves the tested lot properties, incoming tests confirm shipment condition, and the line trial demonstrates actual runnability. Expect some differences between COA values and your incoming inspection results, particularly for moisture-sensitive properties. The key is understanding normal variation versus systematic deviation.
What’s an acceptable Cp/Cpk for pilot acceptance?
There’s no universal threshold because acceptable capability depends on your application criticality and risk tolerance. Many organizations use Cpk ≥ 1.33 as a benchmark for “capable” processes in steady production—this value correlates to a four-sigma process capability. However, during pilots with new fiber mixes or seasonal variables, you should evaluate Cpk alongside actual run data and your complete acceptance criteria rather than treating it as an absolute requirement. For critical properties that directly affect box performance (edge crush strength, moisture stability), target the 1.33 benchmark. For less critical properties, values between 1.0 and 1.33 may be acceptable as a starting point if the mill demonstrates improvement plans and commitment to process centering.
How many pilot reels or tonnes do I need for a fair evaluation?
A minimum of 5-10 reels or approximately 10-15 tonnes provides enough material to assess both statistical variation and converting performance. You need sufficient quantity to run at least one full shift on your converting equipment at production speeds, preferably evaluating material from the beginning, middle, and end of the mill’s production run to detect any systematic drift. The goal is reaching steady-state running across at least two production lots so you observe both variability and runnability under realistic conditions. If you’re qualifying a mill for multiple grades or applications, conduct separate pilots for each—qualification for linerboard doesn’t automatically extend to fluting medium, even from the same mill.
What incoming tests are non-negotiable for first receipts?
At minimum, verify moisture content via TAPPI T 412 or equivalent, basis weight, and your primary strength property (edge crush test, burst, or tensile depending on your application). These three properties capture most of the variation that affects converting performance and box quality. Moisture deserves special attention because it changes during shipping and storage and influences dimensional stability, adhesion in corrugating operations, and sometimes strength properties. Test every reel during the first 2-3 shipments from a new supplier, then implement risk-based sampling as the supplier demonstrates consistency. Equipment calibration is equally non-negotiable—you can’t identify real specification deviations if your testing equipment isn’t properly calibrated and maintained.
How do I scale from pilot to steady supply without quality drift?
Implement a staged volume ramp with enhanced monitoring at each step. Start with commercial orders representing 10-25% of your monthly requirement for low-risk suppliers (those with clean pilot passes and tight capability indices), 5-15% for moderate-risk suppliers (those with minor deviations or seasonal concerns), or 0-10% for high-risk suppliers (those with conditional passes or open CAPA items). Maintain intensive incoming inspection and converting monitoring during this ramp, gradually reducing inspection frequency as the mill proves sustained capability through multiple clean production cycles. Schedule an on-site audit 60-90 days into the commercial relationship to verify the mill maintains the quality systems they demonstrated during qualification. Establish clear CAPA triggers so issues generate structured root cause analysis and corrective action rather than reactive firefighting. Most quality drift occurs because mills relax process controls as volume increases and special attention fades—systematic monitoring and immediate response to deviation prevent small issues from becoming supply chain crises.
Glossary
COA (Certificate of Analysis): Lot-specific test report issued by the mill providing results for all critical properties with test method references. Should include production date, lot/reel identification numbers, and authorization signature.
Capability Matrix: Structured table documenting the range a mill can actually hold on key specifications under normal operating conditions, built from pilot trials and ongoing commercial production data rather than from claimed capabilities.
Cp (Process Capability Index): Statistical measure comparing the specification width to natural process variation, assuming the process is centered on target. Values ≥ 1.33 indicate good inherent capability with comfortable margin for normal variation.
Cpk (Process Capability Index, Centered): Statistical measure accounting for both process variation and process centering, calculated as the distance from the process average to the nearest specification limit. More relevant than Cp for practical qualification decisions because it reflects actual process performance including centering effects.
ECT (Edge Crush Test): Measures the stacking strength of corrugated board by testing a small sample’s resistance to crushing force applied perpendicular to the flutes. Standardized by TAPPI T 811. Critical property for box compression performance and correlates directly to stacking strength in distribution.
BCT (Box Compression Test): Measures the maximum load a corrugated box can withstand before failing, often conducted per ASTM D642. While related to ECT, BCT incorporates box design factors beyond material properties alone.
RCT (Ring Crush Test): Measures the crush resistance of paperboard in a ring configuration. Used historically but largely replaced by ECT for corrugated applications.
SCT (Short-span Compression Test): Measures the compression strength of paper using a short sample span. Standardized by ISO 9895. Provides insight into fiber bonding and internal paper structure.
CAPA (Corrective and Preventive Action): Structured approach to identifying root causes of quality issues (corrective) and implementing system changes to prevent recurrence (preventive). Core requirement within ISO 9001 quality management systems. Includes triggers defining when CAPA is required, documented investigation and analysis, defined actions with owners and timelines, and verification that actions resolved the issue.
Market Intelligence Disclaimer: Any discussion of Incoterms or landed cost comparison methods is provided for educational purposes to help standardize procurement processes. PaperIndex does not offer price indices, market forecasts, or pricing guidance.
Our Editorial Process
Our expert team uses AI tools to help organize and structure our initial drafts. Every piece is then extensively rewritten, fact-checked, and enriched with first-hand insights and experiences by expert humans on our Insights Team to ensure accuracy and clarity.
About the PaperIndex Insights Team
The PaperIndex Insights Team is our dedicated engine for synthesizing complex topics into clear, helpful guides. While our content is thoroughly reviewed for clarity and accuracy, it is for informational purposes and should not replace professional advice.