
📌 Key Takeaways
Procurement teams waste weeks debating supplier quotes because they’re comparing incompatible data—mixed Incoterms, hidden freight legs, and prices without driver context create decision paralysis.
- Price-to-door normalization eliminates ambiguity: Convert every quote—EXW, FOB, CIF, or DDP—to the same delivery point using documented freight rates, HTS codes, and duty calculations, creating a single comparable baseline that finance, logistics, and procurement can all trust.
- Driver-based benchmark bands replace guesswork with structure: Build expected price ranges from fiber costs, energy inputs, freight capacity, foreign exchange, and yield efficiency, then use those bands as a sanity check against incoming quotes to spot off-spec material, outdated inventory, or uncompetitive offers.
- Freight volatility flips supplier rankings faster than unit price: Stress-test every normalized quote against 30-50% freight surges and 20-30% relief scenarios to identify which suppliers offer stable, predictable costs versus those with dangerous freight exposure that can erase apparent savings overnight.
- The assumption log turns decisions into defensible governance: Document every freight rate, HTS classification, carrier, insurance percentage, and delivery constraint used in your calculation, creating an audit trail that explains why you chose one supplier over another—and enables rapid recalculation when market conditions shift.
- Non-price levers determine total cost more than pennies per ton: Payment terms impact working capital, demurrage exposure at congested ports creates hidden charges, quality stability reduces rework costs, and MOQ requirements drive inventory carrying expenses—all of which can outweigh small unit price differences.
Finance leaders, procurement managers, and logistics coordinators in converting operations can apply this four-step integration method to align cross-functional priorities around transparent, auditable supplier selection that withstands scrutiny quarters after the PO is signed.
Executive Summary
Price-to-door decisions combine driver-based benchmark bands with landed-cost normalization to produce defensible, comparable supplier selections. This playbook presents a four-step integration method: establish benchmark bands from cost drivers, normalize all quotes to the same delivery point, stress-test with freight scenarios, and apply a finance-logistics decision matrix while logging all assumptions. The result is an auditable trail that explains why one supplier was selected over another—and when that ranking might flip.
Disclaimer: PaperIndex is a neutral marketplace and does not sell market intelligence or publish pricing indices. Any figures used here are illustrative and for educational purposes only.
Key Terminology
Before diving into the integration method, let’s define the core concepts:
Price-to-Door — A decision flow that combines benchmark bands with to-door normalization so different quotes become comparable.
Benchmark Bands — Expected ranges derived from drivers such as fiber, energy, freight, foreign exchange, and yield.
Landed Cost / To-Door — Total delivered cost including freight, insurance, duties and taxes to your delivery point.
Incoterms® (EXW/FOB/CIF/DDP) — Standard trade terms established by the International Chamber of Commerce that assign cost and risk responsibilities across the shipment. EXW (Ex Works) places maximum responsibility on the buyer, while DDP (Delivered Duty Paid) places maximum responsibility on the seller.
Assumption Log — A concise record of rates, responsibilities, and mappings (such as Harmonized Tariff Schedule codes) used to reach the decision.
Why Supplier Decisions Stall
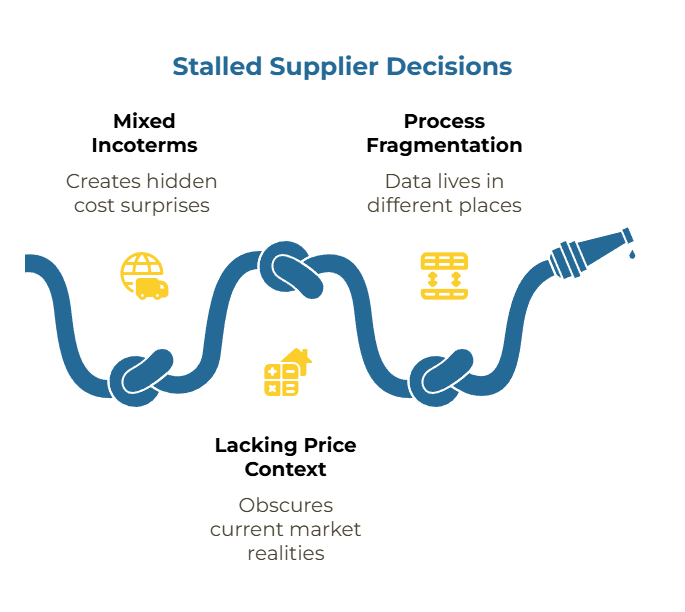
Three suppliers submit quotes. Finance favors the lowest ex-works price. Logistics points out that supplier lacks ocean freight arrangements. Procurement questions whether the price accounts for recent pulp cost increases. The conversation circles for weeks because the team is comparing incompatible data points.
This pattern repeats across converting operations worldwide. Quotes arrive on mixed Incoterms—one EXW, another FOB, a third CIF. Hidden legs create cost surprises. Prices lack driver context, making it impossible to judge whether a quote reflects current market realities or outdated assumptions. Internal stakeholders lose confidence in the selection process when they can’t trace how the decision was made.
The gap isn’t analytical capability. Procurement teams understand cost structures. The problem is process fragmentation. Benchmarks live in one spreadsheet, freight quotes in another, duty calculations in email threads. By the time all pieces come together, market conditions have shifted or the supplier has moved on to other opportunities.
What’s needed is a single flow that connects driver-based expectations to normalized, comparable totals. That’s what price-to-door integration delivers.
Part A: Driver-Based Benchmarks (Bands, Not Points)
Effective benchmarking starts with understanding what drives kraft paper pricing. A benchmark band represents the expected range for a specification, built from underlying cost components rather than historical averages alone.
The Driver Taxonomy
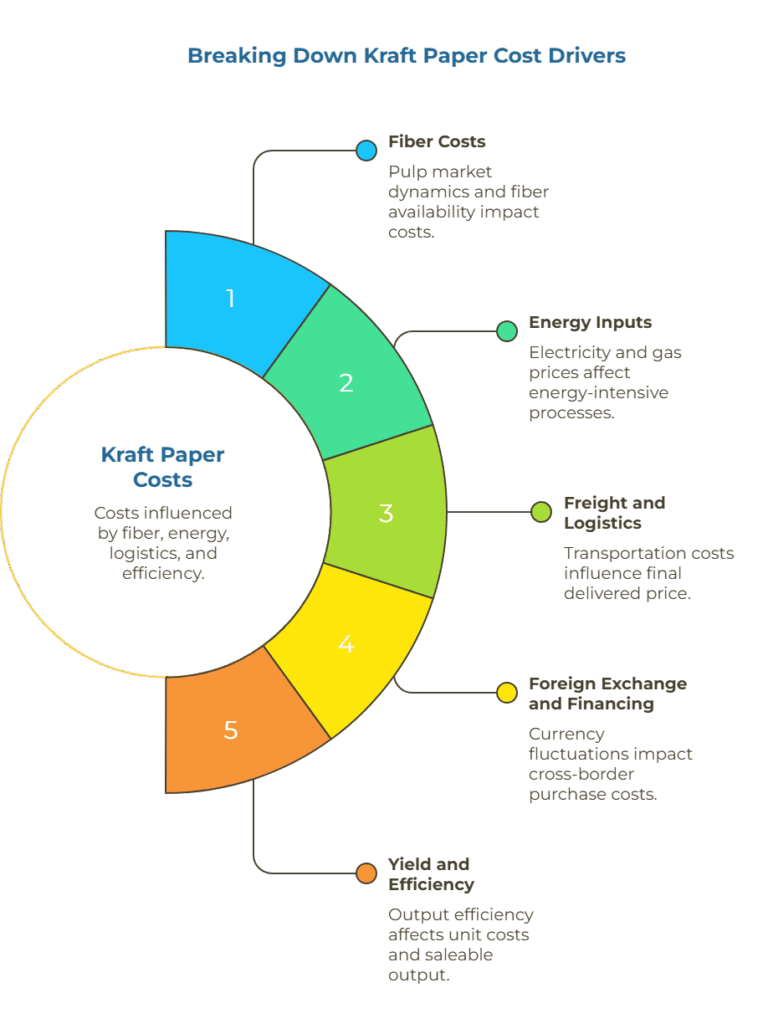
Five primary drivers shape kraft paper costs:
Fiber costs reflect pulp market dynamics, virgin versus recovered fiber spreads, and regional availability. These typically represent 40-60% of total mill costs depending on grade and integration level.
Energy inputs include electricity, natural gas, and steam generation. Energy-intensive processes like pulping and drying make mills sensitive to regional energy price volatility.
Freight and logistics cover inbound raw materials and outbound finished goods. Ocean freight, trucking capacity, and fuel surcharges all influence the final delivered price.
Foreign exchange and financing affect cross-border purchases. Currency fluctuations can swing landed costs by 5-15% even when the supplier’s ex-mill price remains stable.
Yield and efficiency determine how much saleable output a mill generates from given inputs. Higher basis weights, tighter tolerances, or custom specifications may reduce yield and increase unit costs.
The distinction between controllable and non-controllable drivers matters for negotiation strategy. A mill can optimize yield through process control but cannot eliminate global pulp price increases. Recognizing which drivers a supplier can influence helps set realistic expectations during price discussions.
Building Benchmark Bands
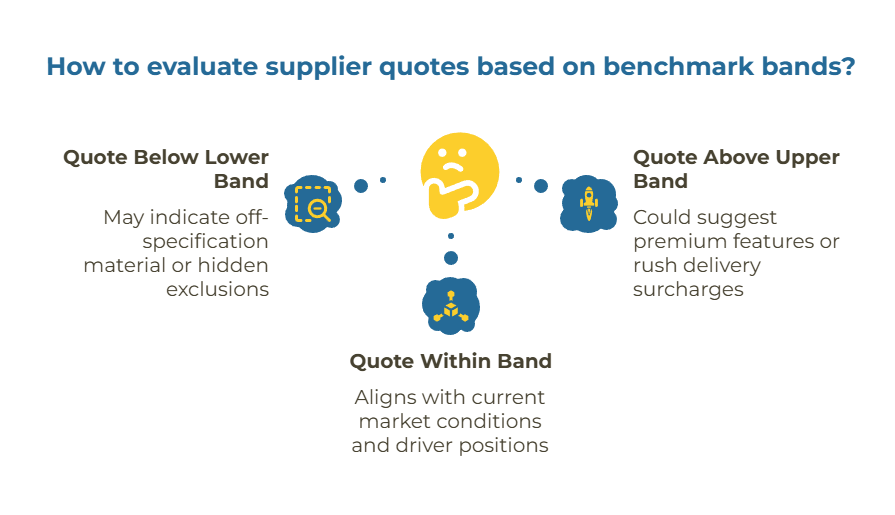
Rather than seeking a single “market price,” establish an expected range. For example, a benchmark band for 70 gsm natural kraft might span $820-$880 per metric ton FOB origin, with the range reflecting current driver positions. If virgin pulp prices are at the high end of their historical range and ocean freight is elevated, expect quotes toward the upper band. If both are moderate, quotes clustering near the lower band make sense.
This approach creates a sanity-check framework. A quote at $750 per metric ton when all drivers suggest $820+ deserves scrutiny—perhaps the supplier is offering off-specification material, working from old inventory, or the quote contains hidden exclusions. Conversely, a quote at $950 when drivers suggest $880 may signal premium features, rush delivery surcharges, or simply an uncompetitive offer.
For more on building and applying benchmark confidence, see Beyond Haggling: Why Driver-Based Benchmarks Create Kraft Paper Procurement Confidence.
Driver Taxonomy Card
Control Drivers (Supplier can optimize):
- Yield and efficiency
- Process waste
- Inventory management
- Production scheduling
Non-Control Drivers (Market-dependent):
- Pulp and fiber costs
- Energy prices (regional)
- Freight capacity and rates
- Foreign exchange movements
Use this card to frame negotiation conversations and identify which cost increases are legitimately market-driven versus operational inefficiencies.
Supplier Lens: When presenting quotes to buyers using driver-based frameworks, explicitly map your pricing to current driver positions. Instead of stating “Our price is $850/MT FOB,” explain: “Our quote of $850/MT FOB reflects current virgin pulp at $X, regional energy costs at Y, and standard lead times. If you require expedited production, yield impacts may shift this by approximately Z%.” This transparency reduces back-and-forth clarification cycles and builds trust that your pricing is defensible.
Part B: Landed-Cost Normalization (Getting to True Door)
A quote stated FOB Shanghai and another stated DDP your warehouse cannot be directly compared without normalization. The Incoterms determine who pays for and manages each leg of the journey, but they don’t eliminate those costs—they just assign responsibility.
Incoterms Responsibilities
The International Chamber of Commerce Incoterms® rules define eleven terms, but four dominate kraft paper transactions:
EXW (Ex Works) means the buyer handles everything from the supplier’s loading dock onward—export clearance, main carriage, insurance, import clearance, and final delivery. The quote is essentially a mill-gate price.
FOB (Free on Board) places the supplier responsible for export clearance and loading onto the vessel. The buyer arranges and pays for ocean freight, marine insurance, import duties, and inland delivery.
CIF (Cost, Insurance, and Freight) means the supplier pays ocean freight and basic marine insurance to the destination port. The buyer still handles import clearance, duties, and inland delivery from the port. CFR (Cost and Freight) is similar but excludes insurance, placing that responsibility on the buyer.
DDP (Delivered Duty Paid) is the most comprehensive term. The supplier delivers to your specified location with all costs and risks covered, including import duties and final-mile delivery.
Each term creates a different total cost picture. An EXW quote might appear lowest on paper but could become the most expensive once you add international freight, customs brokerage, duty payments, and inland trucking that a DDP quote bundles into a single price.
Adding the Missing Legs
Normalization means calculating what every quote would cost delivered to the same point—typically your warehouse or converting facility. For each quote, identify which legs are included and which must be added:
If a quote is EXW, add export documentation, main carriage (ocean or air freight), marine insurance, import customs clearance, duty and tax payments, and inland delivery to your door.
If a quote is FOB, add main carriage, marine insurance, import customs clearance and duties, and inland delivery.
If a quote is CIF or CFR, add import customs clearance and duties, and inland delivery from the destination port. For CFR quotes, also add marine insurance.
If a quote is DDP, verify exactly what “delivered” covers—some suppliers exclude certain local charges or have delivery constraints that create additional costs.
The freight component alone can vary widely based on container type (20-foot or 40-foot), shipping route, carrier, and current capacity constraints. For accurate normalization, obtain actual freight quotes for the specific lane and volume rather than relying on outdated estimates.
Duty and HTS Mapping
Import duties depend on the Harmonized Tariff Schedule (HTS) classification of the goods and the country of origin. Kraft paper products generally fall under HTS chapters 4804-4810, but the specific subheading determines the duty rate. Most-favored-nation rates, free trade agreement preferences, and trade remedy duties all affect the calculation.
Work with a licensed customs broker to confirm the correct HTS code and applicable duty rate for your specific product and origin. The World Customs Organization maintains the Harmonized System, which provides the foundation for tariff classification worldwide. Record the confirmed classification in your assumption log. Duty rates can range from zero (under certain free trade agreements) to double-digit percentages, making this too significant to estimate roughly.
Technical Specifications and Measurement Standards
Keep product specifications crisp to avoid downstream disputes. When grammage, basis weight, and packaging rules are unambiguous, logistics quotes tighten and claims fall. Standards like ISO 536 for paper and board grammage determination provide common technical references that mills and buyers can use to ensure consistent measurement and reduce specification conflicts.
The Assumption Log
Every normalization decision rests on assumptions: the freight rate used, the HTS code applied, the delivery point defined, the insurance percentage. Document these clearly. When freight markets spike or a customs audit reveals a classification error, the assumption log lets you trace exactly why the original decision made sense at the time—and recalculate quickly with updated figures.
A basic assumption log includes: decision date, supplier name, quoted Incoterm and price, freight rate and carrier, insurance rate, HTS code and duty rate, final delivery location, and the person responsible for each assumption.
For a detailed guide on normalizing quotes across different Incoterms, see Comparing Quotes Across Incoterms: Practical Normalization Method for True Door Decisions.
Normalization Checklist
For each quote, verify:
□ Incoterm is clearly stated
□ Freight cost to destination (if not included)
□ Marine insurance (if not included)
□ HTS code and applicable duty rate confirmed
□ Inland delivery from port to facility (if not included)
□ All rates and assumptions logged with date and source
□ Final to-door total calculated and documented
Supplier Lens: When submitting quotes to buyers who normalize to landed cost, provide explicit breakdowns. State your Incoterm clearly and, if possible, include separate line items for freight and insurance even if they’re your responsibility. Specify the HTS code you recommend and note any free trade agreement eligibility. This level of detail eliminates guesswork and positions your quote as professional and transparent, reducing the buyer’s workload and improving your conversion rate.
Part C: Price-to-Door Integration (The Four-Step Method)
Now the integration flow brings benchmarks and normalization together into a defensible decision.
Step 1: Confirm Benchmark Bands
Before evaluating quotes, establish your expected range based on current driver positions. If virgin pulp prices are elevated, ocean freight tight, and the dollar strong against the supplier’s currency, your benchmark band for 80 gsm bleached kraft might be $920-$1,010 per metric ton FOB. Document the driver inputs that produced this band.
Step 2: Normalize All Quotes to the Same Delivery Point
Take each supplier quote and calculate the true to-door cost using the normalization checklist. Supplier A quotes $880 FOB. After adding $140 freight, $8 insurance, $62 duty, and $35 inland delivery, the to-door cost is $1,125. Supplier B quotes $1,095 DDP with everything included. Supplier C quotes $850 EXW, but after adding export facilitation, freight, insurance, duties, and final delivery, the total becomes $1,168.
Suddenly the picture clarifies. Supplier A and B are closely matched on a to-door basis, while Supplier C—which looked cheapest on paper—is actually the most expensive once all legs are included.
Step 3: Run Freight Scenarios
Freight volatility can flip supplier rankings. Test three scenarios:
Baseline scenario: Use current spot or contract freight rates—the figures you just used in normalization.
Surge scenario: Model a 30-50% freight increase, reflecting port congestion, capacity shortages, or fuel price spikes. Recalculate each supplier’s to-door total.
Relief scenario: Model a 20-30% freight decrease, reflecting overcapacity or route optimization.
In the surge scenario, Supplier A’s to-door cost might jump to $1,167 (because their FOB quote carries significant freight exposure), while Supplier B’s DDP quote remains locked at $1,095. The ranking flips. In the relief scenario, Supplier A becomes the clear winner at $1,097.
This stress-testing reveals which suppliers offer stable, predictable costs versus those with high freight sensitivity. According to the UNCTAD Review of Maritime Transport 2023, port congestion and schedule reliability continue to shape logistics risk and cost in global trade. For procurement planning, stability often matters as much as the absolute price.
Step 4: Apply the Finance-Logistics Decision Matrix
Price isn’t the only variable. A complete decision balances financial objectives with operational realities. The Finance-Logistics Decision Matrix provides a structured framework for weighing these factors.
Finance priorities typically emphasize landed cost per unit, payment terms flexibility, currency stability, and total cost of ownership over the contract period.
Logistics priorities focus on lead time reliability, port and route flexibility, container availability, documentation accuracy, and the supplier’s track record for on-time delivery.
Rate each supplier on both dimensions. A supplier with the absolute lowest price but a history of missed delivery windows and incomplete documentation may score poorly on logistics, creating hidden costs through production delays or expedited freight to meet deadlines. Conversely, a supplier with slightly higher pricing but superior logistics execution might deliver better total value.
The matrix doesn’t make the decision for you. It ensures the decision incorporates both cost and operational risk in a transparent, documented way that finance and logistics leaders can both support.
4-Step Integration Diagram
Step 1: Benchmark Bands
↓ (Driver-based expected range)
Step 2: Normalize Quotes
↓ (All quotes to same delivery point)
Step 3: Freight Scenarios
↓ (Baseline / Surge / Relief)
Step 4: Decision Matrix
→ (Finance + Logistics priorities) → Final Selection + Assumption Log
Finance-Logistics Decision Matrix
| Criterion | Weight | Supplier A | Supplier B | Supplier C |
| Finance | ||||
| Landed cost (to-door) | 30% | |||
| Payment terms | 10% | |||
| Currency stability | 10% | |||
| Logistics | ||||
| Lead time reliability | 20% | |||
| Route flexibility | 15% | |||
| Documentation quality | 15% | |||
| Total Score | 100% |
Customize weights based on your organization’s priorities. A just-in-time operation may weight lead time reliability higher, while a business exposed to currency risk may emphasize forex stability.
What Flips the Winner: The Non-Obvious Levers
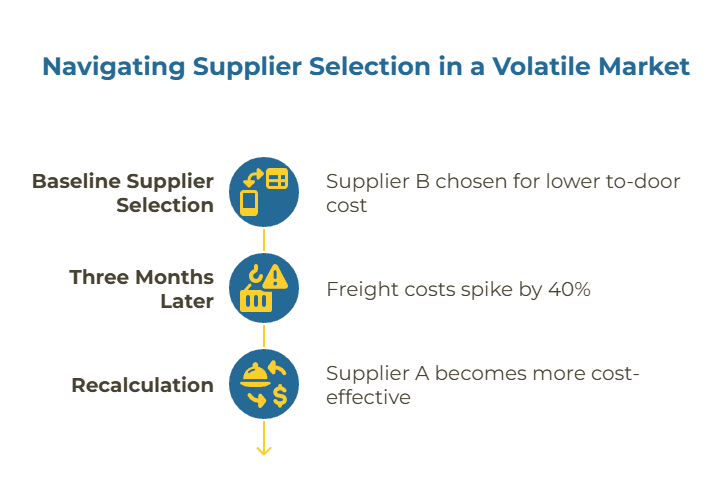
Consider two suppliers after normalization: Supplier A at $1,110 to-door and Supplier B at $1,095 to-door. Supplier B wins on price. Finance approves the PO.
Three months later, a port labor dispute and bunker fuel surcharge hit your primary shipping lane. Freight spikes 40%. When you recalculate, Supplier A—which quoted CIF and absorbed most freight risk—rises to $1,152. Supplier B, quoted FOB, jumps to $1,151. The financial advantage evaporates. Meanwhile, Supplier A’s logistics score remains strong due to alternate routing capabilities, while Supplier B struggles with container availability on the congested lane.
The original decision was correct based on the data available. The assumption log documents the freight rate and carrier used. When conditions changed, the framework allowed rapid recalculation and a defensible explanation to stakeholders: “Supplier B was selected based on to-door cost advantage under baseline freight conditions. The recent 40% freight increase eliminated that advantage, and Supplier A’s route flexibility now provides better value.”
Beyond freight volatility, several other factors can shift supplier rankings:
Lead time variance and stockout risk: A slightly higher door price with reliable transit can reduce total cost when stockout penalties or expediting expenses are high. Consistent delivery performance becomes worth a price premium.
Payment terms and cost of capital: Extended payment terms can offset unit price differences once you account for the cost of working capital. A supplier offering net-60 terms versus net-30 provides a financing benefit that may exceed a small per-ton price advantage from a competitor.
Demurrage and detention exposure: Options that avoid congested ports or provide longer free time can dominate outcomes during peak shipping seasons. Demurrage charges at major ports can quickly erase apparent savings from a lower quoted price.
Claims, quality stability, and rework costs: A supplier with tighter specifications and fewer quality claims can outweigh savings of several cents per kilogram. Hidden costs from returns, rework, and customer complaints often exceed the initial price differential.
Minimum order quantities and inventory carrying costs: MOQ requirements influence warehouse space needs, working capital tied up in inventory, and ordering frequency. A supplier with flexible MOQ may provide better total economics than one with a marginally lower unit price but rigid volume requirements.
The most common mistake is anchoring on the ex-factory price without considering exposure to freight, duty, or currency volatility. An EXW quote might be $50 per ton lower than a DDP quote, but if freight surges or import duties increase, that $50 advantage can become a $100 disadvantage. Always anchor on the normalized, to-door total after stress-testing.
Governance and Auditability
Supplier selection under price-to-door integration is defensible because it’s documented. The assumption log, benchmark drivers, normalization calculations, and decision matrix scores create a complete audit trail.
The Assumption Log Template
A minimal assumption log captures:
- Decision Date: When the selection was made
- Supplier & Incoterm: Who and what terms
- Quoted Price: The supplier’s stated price
- Freight Rate & Carrier: Rate used and routing
- Insurance Rate: Percentage applied
- HTS Code & Duty: Classification and rate
- Delivery Location: Final to-door point
- Owner: Who validated each assumption
Store this log with the PO and share it with finance, logistics, and quality assurance teams. When questions arise months later—”Why did we choose this supplier?”—the log provides immediate answers.
When to Revisit the Decision
Certain events trigger a recalculation:
Freight market shifts: If spot rates move more than 20% from baseline assumptions, rerun the scenarios. Container shipping markets can swing dramatically in short periods, particularly during peak seasons or capacity disruptions.
Currency movements: A 10% or greater shift in the exchange rate between your currency and the supplier’s currency justifies recalculating landed costs, especially for contracts longer than six months.
Duty or trade policy changes: Tariff increases, trade agreement modifications, or customs reclassifications directly affect landed costs. Monitor government trade authority announcements and work with customs brokers to stay current.
Supplier performance issues: If a supplier’s logistics score degrades—repeated late deliveries, documentation errors, quality problems—the decision matrix may shift even if pricing remains stable.
Build a quarterly review cadence into procurement workflows. Even if no triggers fire, a periodic check ensures the original assumptions still hold and the selected supplier continues delivering expected value.
Assumption Log Micro-Template
| Field | Entry |
| Decision Date | [YYYY-MM-DD] |
| Supplier Name | |
| Incoterm & Price | [e.g., FOB $880/MT] |
| Freight (Route/Rate/Carrier) | [e.g., Shanghai-LA / $140 / Carrier X] |
| Insurance Rate | [e.g., 0.9%] |
| HTS Code & Duty | [e.g., 4804.31 / 5.2%] |
| Delivery Location | [Your facility address] |
| Validated By | [Name/Role] |
| Notes/Conditions | [e.g., Rate valid through Q2; review if bunker surcharge exceeds X] |
Frequently Asked Questions
Is price-to-door the same as landed cost?
No. Price-to-door is the normalized commercial baseline—what it takes to get the product to your door, with time and risk made explicit. Landed cost layers in duties, taxes, and can include financing costs and internal handling expenses. Use price-to-door first to create comparable quotes; then extend to full landed cost for final decision-making.
Can small buyers use this method?
Yes. The method scales to any procurement operation. Small buyers often gain the most by removing scope ambiguity and asking suppliers to map charges to clear drivers. The discipline of documenting assumptions and normalizing quotes prevents costly surprises regardless of purchase volume.
What if a supplier won’t unbundle local charges or provide transparent breakdowns?
Treat the gap as a risk cost reserve or disqualify the quote until scope becomes clear. If a supplier refuses to specify what their “delivered” price includes, you cannot normalize it reliably against other options. Document this choice in your assumption log and communicate to stakeholders why that supplier was excluded from consideration.
Moving Forward: Your Integration Checklist
You now have a complete method for price-to-door supplier selection. Before your next sourcing round, ensure:
□ Driver-based benchmark bands are established for your key specifications
□ All quotes are normalized to the same to-door delivery point
□ Freight scenarios (baseline, surge, relief) are tested
□ Finance and logistics priorities are weighted in the decision matrix
□ All assumptions are logged and validated
□ A review cadence is set for market condition monitoring
This isn’t just a procurement framework. It’s a common language that aligns finance, logistics, and operations around defensible, comparable supplier decisions. When the CFO asks why you chose Supplier B over Supplier A, you don’t explain—you show the assumption log and the decision matrix. The reasoning is transparent, the math is documented, and the selection is defensible.
For deeper exploration of each component, visit the PaperIndex Academy for additional guides on Incoterms for Kraft Paper Buyers and Benchmark vs Quote Sanity Checks.
Ready to put the playbook into practice? Find kraft paper suppliers on PaperIndex, submit an RFQ with clear Incoterm specifications, or explore packaging paper suppliers that align with your requirements. For suppliers looking to improve quote quality and conversion rates, list your company free and gain visibility to procurement teams using these decision frameworks.
Disclaimer: This article provides general guidance on freight scenario analysis for procurement decisions. Actual freight rates, trade lane volatility, and duty calculations vary by geography, carrier agreements, and product specifications. Consult with logistics, trade compliance, and finance teams to ensure all cost elements are accurately modeled for your specific sourcing context.
Our Editorial Process
Our expert team uses AI tools to help organize and structure our initial drafts. Every piece is then extensively rewritten, fact-checked, and enriched with first-hand insights and experiences by expert humans on our Insights Team to ensure accuracy and clarity.
About the PaperIndex Insights Team
The PaperIndex Insights Team is our dedicated engine for synthesizing complex topics into clear, helpful guides. While our content is thoroughly reviewed for clarity and accuracy, it is for informational purposes and should not replace professional advice.