
📌 Key Takeaways
Stop debating whether supplier quotes are “fair” and start using a systematic three-step method that transforms pricing uncertainty into defensible procurement decisions.
Benchmarks Are Guardrails, Not GPS Coordinates: Use driver-based ranges to validate whether quotes fall within reasonable market bounds rather than trying to negotiate down to specific numbers.
Convert Headlines to Reality Before Comparing: Calculate effective cost per usable tonne by adjusting for spec differences and waste factors, because a lower sticker price often masks higher true costs.
Flag First, Normalize Later: Document logistics and terms differences during initial evaluation, then run full comparability analysis only when gaps appear material.
Document Every Assumption: Create a one-page assumption log that records benchmark sources, driver selections, and adjustments to reduce approval friction and support negotiations.
Position Determines Strategy: Proceed when quotes fall within adjusted ranges, negotiate when slightly outside with clear rationale, and re-RFQ when gaps exceed 15% of the benchmark band.
Turn procurement guesswork into systematic validation that stakeholders can trust and defend.
For professional kraft paper buyers and sourcing managers who need fast, defensible methods to evaluate supplier quotes under time pressure while building stakeholder confidence in procurement decisions.
A benchmark is a range, not a target. Use it to sanity-check a supplier quote—after aligning on drivers (grade/spec/region) and adjusting for spec-true yield and logistics/terms. This quick method reduces “is this fair?” debates and helps decide whether to proceed, negotiate, or re-RFQ for your 2025-26 sourcing cycles.
Picture this: you receive three kraft paper quotes with prices that vary by 15%. Without a systematic approach, you’re left wondering which kraft paper supplier is fair and which might be taking advantage. The temptation is to grab the lowest number and run with it, but experienced buyers know this leads to quality surprises and budget headaches later.
You need a defensible way to evaluate quotes quickly. More importantly, you need a method that creates an assumption log your team can reference during approvals and negotiations.
Start With Benchmarks, Not Absolute Prices
Benchmarks are ranges informed by drivers, not targets. When you access driver-based benchmarking data, you’re looking at bands that reflect grade specifications, regional dynamics, and typical market conditions. These ranges serve one primary purpose: helping you determine whether a supplier quote falls within reasonable bounds.
Treat any range as orientation—confirm the grade and spec match your intended use before comparison. The benchmark’s value lies in providing market context, not in dictating your negotiation position.
| Item | Scope | Basis | Value (illustrative) |
| Supplier quote | As offered | EXW | 720 |
| Benchmark range (driver-aligned) | Same grade/spec/region | EXW | 680–740 |
| Adjusted benchmark (after spec/yield flags) | Comparable to quote | EXW | 700–760 |
This matrix shows how a quote is judged relative to a range once aligned and adjusted. Numbers are illustrative, not market data.
For kraft paper procurement, this approach becomes particularly valuable because driver-based benchmarks for procurement confidence account for the complex interplay between raw material costs, regional capacity, and specification requirements that influence pricing.
When a Benchmark Alone Misleads
Spec changes affect yield and effective cost per usable tonne. Basis weight differences in gsm, strength specifications such as burst or RCT values, and Cobb requirements shift usable yield calculations. A 120gsm kraft paper quote cannot be directly compared to a benchmark derived from 100gsm specifications without adjustment.
Logistics deltas impact to-door comparability and should be flagged before negotiation. Incoterms alter delivered economics significantly. A CIF quote includes insurance and freight, while an EXW quote leaves those costs entirely in your hands. For authoritative Incoterms definitions, reference the International Chamber of Commerce overview of Incoterms® 2020.
Currency exposure and payment terms widen comparison bands further. Logistics costs often include freight, insurance, handling, and last-mile components that vary substantially by region and trade lane. For neutral context on cost components and trade logistics, see resources from UNCTAD and the World Bank’s trade facilitation materials.
Quote and benchmark must be compared on the same commercial basis—matching Incoterms, currency, and payment terms—before any meaningful evaluation can occur.
The 3-Step Sanity-Check Method
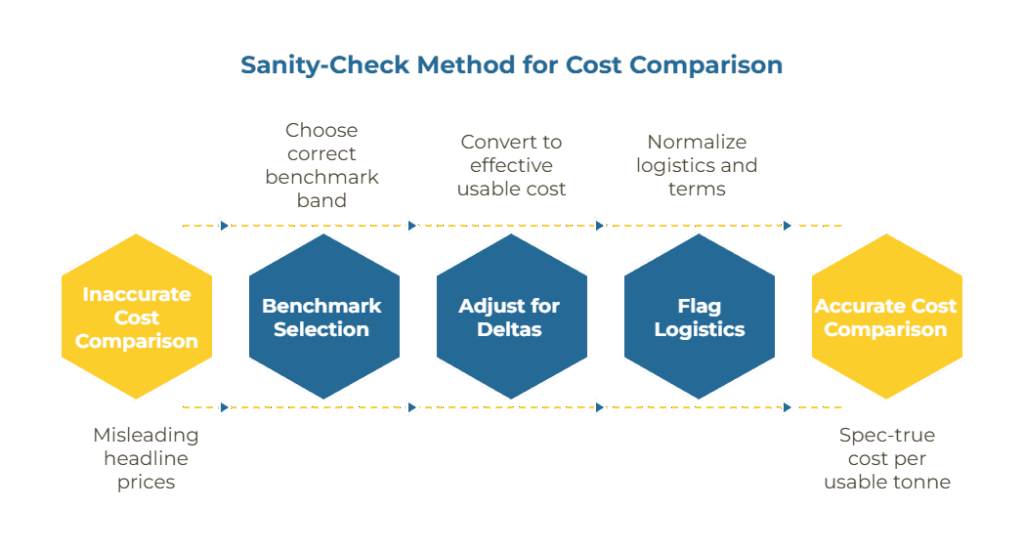
Step 1: Pick the correct benchmark band by driver. Choose by grade, specification, and region. If your benchmark comes from a different region, note the delta as an assumption and adjust only if you have a defensible lane differential. Document your driver selections carefully.
This step requires matching your product requirements to the benchmark’s underlying assumptions. For kraft paper, ensure alignment on basis weight category, strength requirements, and regional sourcing patterns before proceeding. See why to-door comparability beats cheapest quote thinking for context on proper driver selection.
Step 2: Adjust for spec and yield deltas. Convert to effective cost per usable tonne rather than comparing headline prices directly. Specifications that increase waste or reduce strength-true suitability raise effective cost even when the sticker price appears attractive.
The adjustment accounts for material density differences and manufacturing tolerances that affect your actual consumption. Understanding comparability before price through the spec-true mindset helps prevent specification-driven surprises in your procurement process.
Step 3: Flag logistics and terms deltas for later normalization. Perform a lightweight flag initially—if the gap remains material after basic adjustments, run a full to-door normalization later. Don’t attempt complex normalization at this sanity-check stage.
Create flags for separate evaluation: currency exposure, Incoterms variations, and payment term impacts. The Incoterms normalization method from the Academy provides systematic approaches for complex logistics adjustments when needed.
Adjustments: Spec, Yield and Logistics Deltas
Effective comparison demands two distinct passes: technical spec-true yield adjustment and commercial logistics/terms differential analysis.
Spec-true yield adjustment: Basis weight tolerance, strength characteristics (burst/RCT), and Cobb values can change trim loss and fit-for-use yield significantly. This affects the cost per usable tonne calculation. Industry commonly references TAPPI and ISO standards for test methods, though specific values vary by application.
Logistics and terms differential: Incoterms (EXW vs FOB vs CIF vs DDP), currency exposure, and payment terms shift economics substantially. Normalize only when you have defensible lane differential data or known terms impact—otherwise log the assumption and proceed.
Risk Mitigation Considerations
Don’t over-fit minor specification differences that fall within normal manufacturing tolerances. Ensure any adjustment exceeds typical variation before applying complex calculations.
Keep a detailed assumption log that records each driver selection and every adjustment made. This documentation reduces internal approval friction and supports supplier discussions with transparent methodology.
Mind unit consistency carefully—confirm gsm versus lb/1000 ft², reel width specifications, and reel count to avoid hidden yield mismatches that distort comparisons.
Worked Example With Illustrative Numbers
Scenario (illustrative only): Quote shows EXW 720 for 80gsm kraft with ±3% tolerance, expecting 3.5% trim/waste on your production line. Benchmark band (aligned on grade/spec/region) shows EXW 680–740. Testing reveals a near-substitute specification produces 5.0% waste on the same line.
Calculation method: Effective cost per usable tonne = Sticker price ÷ (1 − waste %)
| Item | Waste % | Effective Cost |
| Supplier quote | 3.5% | 720 ÷ 0.965 = 746.1 |
| Benchmark (low end) | 3.5% | 680 ÷ 0.965 = 704.7 |
| Benchmark (high end) | 3.5% | 740 ÷ 0.965 = 766.5 |
| Alt spec (quote unchanged) | 5.0% | 720 ÷ 0.95 = 758.9 |
Interpretation: With original yield assumptions, the quote (746.1 effective) sits within the adjusted benchmark band (704.7–766.5). With slightly worse yield, the same sticker price moves closer to the band’s upper limit (758.9 vs 766.5), changing negotiation posture.
If subsequent logistics normalization adds a defensible +10–15 to reach a delivered-comparable basis, the position may remain reasonable—but only if properly documented.
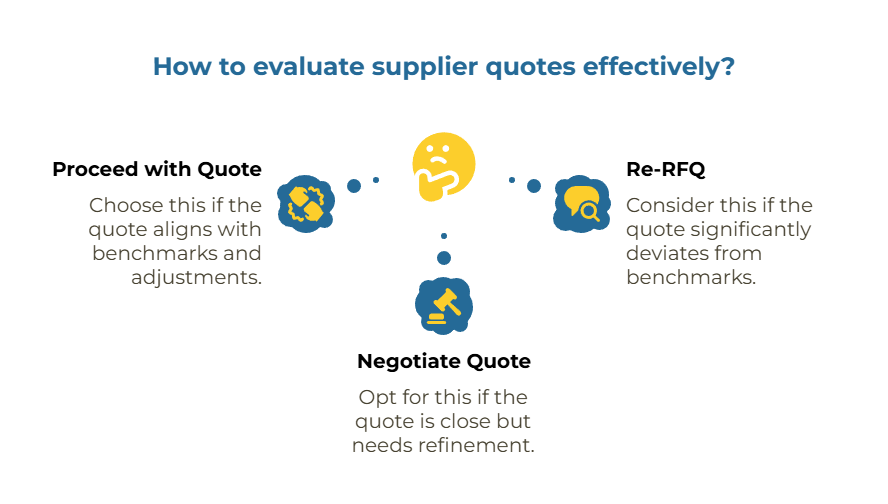
Decision Outcomes and Next Steps
Proceed when your adjusted quote falls within the benchmark range and assumptions are well-documented. Focus negotiation on terms, delivery schedules, and service commitments rather than challenging fundamentally fair pricing.
Negotiate when quotes sit slightly outside the range but show clear rationale—performance advantages, superior service levels, or favorable minimums that justify premium positioning.
Re-RFQ when gaps exceed 15% of the adjusted benchmark range or when underlying data appears weak. Seek cleaner specification alignment and terms standardization to restore meaningful comparability.
Share your one-page comparison table and assumption log with stakeholders for rapid approval. This transparency builds confidence in procurement recommendations and reduces second-guessing during implementation.
Checklist: Inputs to Log for Approvals
□ Benchmark range + source/date – Document data provider, publication date, and any limitations
□ Product grade & specs – Basis weight, burst/RCT values, Cobb requirements, and manufacturing tolerances
□ Yield impact notes – GSM adjustments, trim loss estimates, and line-specific test results
□ Logistics & Incoterms notes – Delivery terms, freight responsibilities, and lane considerations
□ Currency & payment terms – Exchange rate exposure, net days, and early payment discount structures
□ Assumptions owner + approval path – Identify who validated methodology and required sign-offs
This systematic documentation creates institutional knowledge for future sourcing cycles while providing defensible rationale for current procurement decisions.
What’s Certain vs Variable
Verified methodology: Benchmarks function as ranges for sanity-checking; spec/yield and logistics/terms require adjustment; three-step method provides systematic approach; assumption logging supports governance.
Generally accepted practice: Normalize by effective cost per usable tonne; align Incoterms, currency, and payment terms before comparing; reference industry-standard test methods for specification discussions.
Context-dependent factors: Actual lane differentials, duty/tax treatment, and plant-specific yield characteristics vary significantly by situation. Treat example numbers as illustrative only—your specific applications require tailored analysis.
Explore more procurement guides in PaperIndex Academy
Join PaperIndex Free to contact verified suppliers | Submit RFQ & Receive Quotes Free
Disclaimer: This guide is for professional education. PaperIndex is a neutral marketplace and does not sell market-intelligence products or publish price indices. Treat any numbers as illustrative unless a public source is cited.
Our Editorial Process
Our expert team uses AI tools to help organize and structure our initial drafts. Every piece is then extensively rewritten, fact-checked, and enriched with first-hand insights and experiences by expert humans on our Insights Team to ensure accuracy and clarity.
About the PaperIndex Insights Team
The PaperIndex Insights Team is our dedicated engine for synthesizing complex topics into clear, helpful guides. While our content is thoroughly reviewed for clarity and accuracy, it is for informational purposes and should not replace professional advice.