
📌 Key Takeaways
Price opacity kills procurement confidence, but driver-based benchmarks transform chaotic quotes into defensible decisions.
Replace Single Numbers with Smart Bands: Driver-based benchmarks use ranges tied to fiber, energy, freight, currency, and yield factors instead of brittle single-point estimates that break when markets shift.
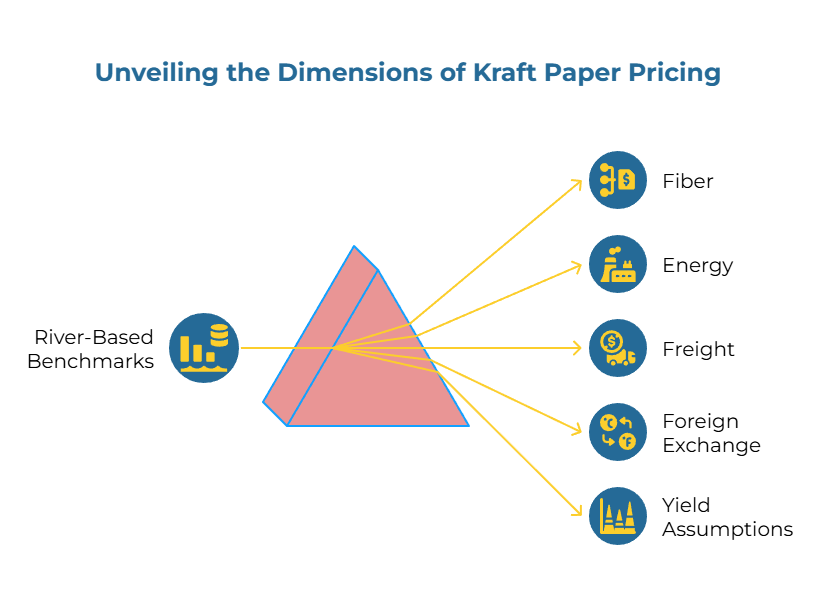
Map the Five Core Drivers: Fiber costs anchor your base price, energy adjusts regional competitiveness, freight reorders supplier rankings, currency movements amplify or dampen changes, and yield assumptions convert specifications into real usable tons.
Document Every Assumption: Assumption logging prevents invoice disputes by recording Incoterms basis, currency conversion dates, specification tolerances, and freight inclusions that turn quote comparisons into audit-ready decisions.
Normalize to True Door Costs: Converting all quotes to identical delivery terms reveals hidden costs and often flips supplier rankings when EXW prices add freight, duties, and handling fees.
Build Cross-Functional Alignment: Shared benchmark worksheets give Finance transparent cost structures, provide Logistics clear evaluation frameworks, and show Operations how specifications affect yield calculations.
Driver-based intelligence turns procurement guesswork into systematic advantage.
For procurement leaders managing kraft paper sourcing who need to satisfy Finance, Logistics, and Operations stakeholders while defending price targets under time pressure.
Executive Summary
Driver-based benchmarks outperform ad-hoc quotes for building defensible, shareable price targets in kraft paper procurement. This framework breaks down pricing into five core drivers—fiber, energy, freight, foreign exchange, and yield assumptions—creating transparent benchmark bands rather than single-point estimates. The approach enables procurement teams to normalize quotes across different specifications and Incoterms, building internal alignment between Finance, Logistics, and Operations while strengthening negotiating positions through documented assumptions and auditability trails.
Turbulence happens. Forklifts hum, stacks of reels thud into place, and a buyer’s phone lights up with two wildly different quotes for what looks like the same kraft paper.
You need a way to defend a target price that others will accept. Not a guess. Not the loudest supplier. A structure that explains the gap, survives review, and travels well across teams.
Think of driver-based price intelligence as an altimeter for sourcing decisions. Like an altimeter that stabilizes flight decisions during turbulence, this framework provides reliable reference points when market conditions shift and supplier quotes vary significantly. By isolating a few measurable drivers—fiber, energy, freight, foreign exchange, and yield—you turn opaque quotes into comparable, to-door totals and create bands that reflect reality instead of a single brittle number.
What Is Kraft Paper Price Intelligence?
Kraft paper price intelligence is a driver-based benchmarking method that replaces ad-hoc quotes with bands tied to core inputs: fiber/pulp, energy, freight, FX, and yield. Teams use it to normalize to to-door totals, explain price deltas, and publish defensible targets for RFQs and negotiations that Finance and Operations can support.
Traditional procurement approaches treat prices as fixed numbers provided by suppliers. Driver-based intelligence recognizes that every kraft paper price reflects the interaction of multiple underlying factors: fiber costs, energy inputs, logistics expenses, currency fluctuations, and yield assumptions based on specifications.
Consider two seemingly similar quotes for 80 GSM sack kraft. Supplier A quotes $680 EXW Hamburg but assumes generous yield tolerances. Supplier B offers $720 CIF Newark with tighter specification controls. The $40 difference appears straightforward until you examine the drivers. When you expose the underlying factors—freight costs, currency basis, and realistic trim loss calculations—the “cheap” offer loses ground. Supplier B’s inclusive pricing and tighter quality controls deliver superior to-door value once normalization is complete.
This decomposition approach serves three critical functions: it enables apples-to-apples comparisons across suppliers operating in different cost environments, provides transparent justification for price targets that Finance and Operations teams can validate, and creates benchmark bands that remain useful even as individual supplier quotes fluctuate.
Driver Taxonomy and Benchmark Bands
Focus on five drivers. Assign each a realistic band rather than a single point and define when the band should widen or narrow. Then combine them into a benchmark range for comparable to-door pricing.
Fiber and Pulp Inputs
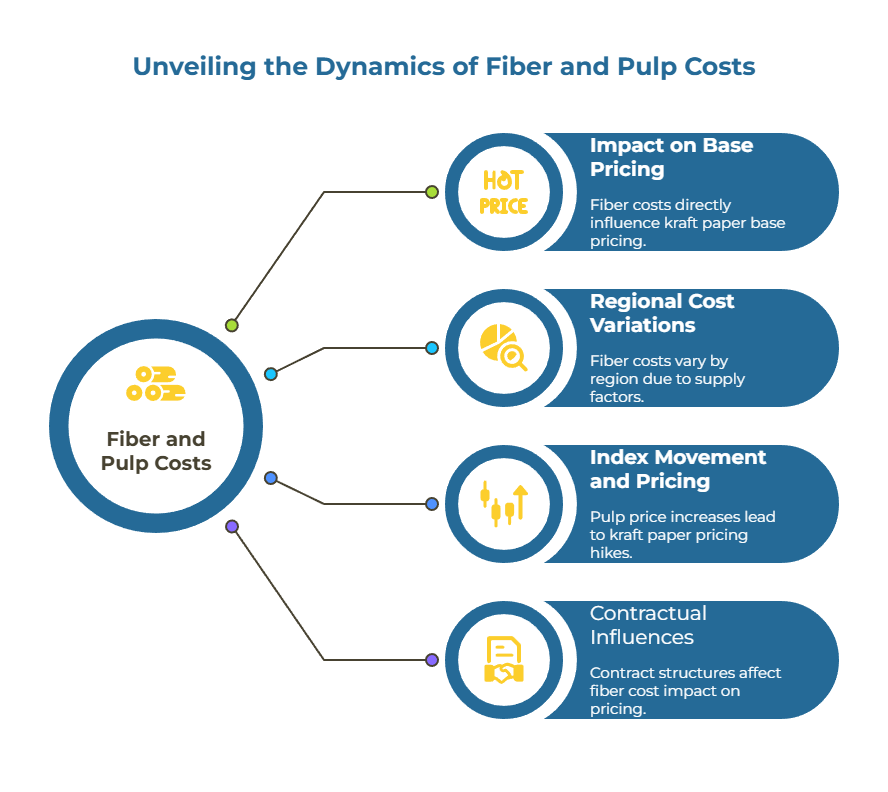
Fiber costs are the primary driver of kraft paper price variations, significantly influencing base pricing. Virgin fiber markets respond to forestry conditions, alternative demand from lumber and other paper grades, and regional supply-demand balances.
What it does to bands: Fiber sets the base price level; benchmark bands should move with widely tracked pulp and recovered paper indices.
When to widen: Expand bands when grade spreads are volatile or when substitutes like recycled versus virgin blends enter the mix. Northern European producers typically face higher fiber costs compared to Southeast Asian suppliers, while North American mills benefit from integrated forestry operations.
When to narrow: Tighten bands when your specification locks in grade and region precisely and when recent index movement is modest.
The relationship between fiber indices and base pricing follows predictable patterns. An increase in pulp prices typically translates to increases in kraft paper pricing, depending on the mill’s integration level and contract structures with fiber suppliers.
Energy Components
Energy is a major component of kraft paper production costs, with its impact varying widely by region and mill efficiency. What it does to bands: Energy influences mill conversion cost; changes typically ripple through with lags and region-specific intensity.
When to widen: Expand during fuel or electricity shocks and for energy-intensive grades. European mills face energy costs slightly higher than facilities in regions with abundant natural gas or hydroelectric power.
When to narrow: Tighten when mills hedge effectively or when energy inputs are stable relative to fiber costs.
Energy benchmarks should reflect both the overall cost and volatility patterns. Mills in regions with high energy costs often add a premium to prices to guard against energy fluctuations, while those with stable, low-cost energy can provide more predictable pricing.
Freight and Logistics
Freight costs reshape supplier rankings more than any other single factor. What it does to bands: Freight changes supplier ranking across lanes even when base prices appear similar—including ocean rates, port fees, drayage, and inland legs.
When to widen: Expand during capacity crunches, peak seasons, or route disruptions. Ocean freight rates can fluctuate significantly during market volatility, drastically changing the competitive landscape between suppliers in different regions.
When to narrow: Tighten on short, reliable lanes or when using long-term freight contracts.
For standardized delivery obligations, consult the ICC Incoterms rules, which provide official definitions for EXW, FOB, CIF, and DDP terms.Asia-Europe container rates can vary greatly based on market conditions, significantly impacting kraft paper pricing for standard container loads.
Foreign Exchange Dynamics
Currency movements amplify or dampen apparent price changes, particularly for buyers working across multiple currency zones. What it does to bands: FX can amplify or dampen movements from other drivers after conversion to your reporting currency.
When to widen: Expand when paying suppliers in multiple currencies or when FX basis dates vary across quotes. A 10% change in currency can significantly outweigh differences in supplier efficiency.
When to narrow: Tighten if contracts specify fixed conversion basis or short settlement windows.
The Federal Reserve publishes daily foreign exchange rates suitable for benchmarking purposes, providing standardized conversion approaches for U.S. buyers. Mills typically price contracts 30-90 days ahead, creating lag effects where currency movements take time to appear in quoted prices.
Yield and Waste Assumptions
Specification differences create hidden yield variations that dramatically impact effective pricing. What it does to bands: Yield converts specification into effective price. Small changes in basis weight, moisture, or tolerance can materially change usable output per ton.
When to widen: Expand with tighter dimensional tolerances, frequent changeovers, or high trim applications. Two suppliers quoting identical $/MT prices may deliver vastly different value once yield factors and quality parameters are considered.
When to narrow: Tighten where reels and formats match your converting lines with minimal waste.
Basis weight tolerances, moisture content, and caliper variations all impact the usable yield from each shipment. A supplier with wider tolerance ranges may deliver less usable material compared to one with tighter tolerances, depending on quality standards. The ISO 536 standard provides the technical foundation for how basis weight measurements should be conducted.
Building Your Driver-Based Benchmark Worksheet
Create a single worksheet with inputs for each driver, define bands rather than single numbers, and maintain an explicit assumption log. The worksheet becomes your zero-click, shareable “price altimeter.”

Copy-Ready Benchmark Worksheet Structure
Inputs & Bands (fill once per update cycle):
- Fiber/Pulp Band: Min-max in your base currency
Note: Anchor to a recognized pulp/recovered index category that reflects your spec mix - Energy Band: Min-max per ton impact
Note: Include electricity/fuel surcharges if common in your lanes - Freight Band (Ocean + Inland): Min-max per ton to-door
Note: Separate ocean, port/drayage, and inland legs for transparency - FX Band: Conversion band with basis date
Note: Record the basis date and rate source used for conversion - Yield Factor Band: Usable output percentage or effective tons
Note: Tie to spec details—basis weight, moisture, tolerances, typical trim
Roll-Up Calculations:
- Composite to-door benchmark band: Calculated min–max per ton delivered
- Supplier/lane comparison view: Rank by midpoint and spread
- Decision flags: “Review if quote below min” / “Revisit if quote above max”
Assumption Log (maintain with the worksheet):
- Incoterms basis per quote (EXW/FOB/CIF/DDP) and included legs
- FX basis date and rate source for each conversion
- Spec-to-yield mapping showing how stated specifications translate into usable output
- Freight inputs including carrier class, typical surcharges, seasonality notes
- Exceptions/overrides with approval authority, date, and reason
This framework transforms supplier quotes from isolated data points into comparable positions within established ranges. Instead of debating whether $720/MT represents fair value, teams can evaluate whether a quote falls within the expected band given current driver positions and documented assumptions.
From Benchmark to Decision: Integrating Landed-Cost Analysis
Always translate quotes to to-door totals. This means normalizing Incoterms, adding duties where applicable, and rolling ocean, port, and inland legs into a single comparable number.
Normalization Checklist for To-Door Comparability:
- Incoterms basis aligned and converted to to-door using ICC Incoterms rules
- Duties/HTS code confirmed using tools like the USITC HTS search for U.S. imports
- Ocean freight + port fees + inland legs consistently included
- FX basis date and source recorded across all quotes
- Spec-to-yield assumptions aligned to your converting lines
- Effective price expressed on the same unit (per delivered metric ton)
Consider a practical normalization example: Supplier A quotes $680/MT EXW Hamburg, while Supplier B offers $750/MT DDP delivered. The initial comparison suggests a $70/MT advantage for Supplier A. However, after adding $45/MT for inland freight, $25/MT for handling and customs clearance, $30/MT for ocean freight, and $15/MT for duty calculations, Supplier A’s true cost reaches $795/MT—$45/MT higher than Supplier B’s inclusive pricing.
The normalization process often reveals dramatic shifts in supplier rankings. A supplier offering attractive EXW pricing may become uncompetitive once freight, duties, and handling costs are included. Conversely, suppliers with higher quoted prices but inclusive Incoterms may deliver superior to-door value.
Assumptions and Auditability
Logging assumptions prevents the most common source of procurement disputes: misaligned expectations about cost inclusions and quality standards. Clear documentation serves multiple purposes beyond audit compliance—it enables rapid recalibration when market conditions change and provides transparent justification for supplier selection decisions.
Critical Documentation Requirements:
Price Basis Assumptions:
- Quote’s Incoterms and which legs are included/excluded
- FX basis date and published rate source
- Specification details affecting yield (basis weight, moisture, tolerances, trim)
- Any overrides on energy surcharges and approval authority
Quality Standards:
- Exact GSM, burst strength, Cobb values, and acceptable tolerances
- Moisture limits, caliper consistency, surface quality standards
- Packaging and palletization requirements affecting handling costs
- Delivery timing and scheduling flexibility impacting logistics costs
This documentation enables proactive supplier discussions about specification changes, cost pass-throughs, and contract adjustments. Rather than reacting to invoice disputes after delivery, teams can address potential misalignments during quotation and negotiation phases.
Applying Benchmarks Across RFQs and Negotiations
Use the worksheet to frame conversations: share driver bands upfront, publish the to-door normalization method, and ask suppliers to respond within those guardrails.
RFQ Checklist:
- Include your driver bands and update cadence
- State the Incoterms basis and to-door normalization method
- Require a yield note showing how spec assumptions translate to usable output
- Request FX currency and proposed basis date if not invoiced in your currency
- Ask for freight breakdown (ocean, port/drayage, inland) for transparency
- Define review triggers: prices outside the band require justification with drivers
Negotiation Framework:
- Use benchmark bands to establish reasonable price targets rather than single-point negotiations
- Address specification assumptions explicitly to prevent yield disputes
- Discuss freight and Incoterm options to optimize total delivered cost
- Document negotiated assumptions in contract terms to prevent future disputes
Spec-to-Yield Note: When you change a tolerance, you likely change effective price. Always connect specification edits to yield calculations and rerun the band—especially for formats with high trim or frequent changeovers.
Pitfalls and Guardrails
Most failures trace back to misread Incoterms, missing freight legs, mismatched FX bases, or undocumented yield assumptions.
Common Failure Modes and Mitigations:
| Failure Mode | Mitigation |
| Term misread (EXW vs. CIF vs. DDP) | Normalize every quote to to-door using shared rules; cite ICC Incoterms |
| Freight spikes change rankings | Maintain freight bands with regular updates; separate ocean/port/inland to identify which leg moved |
| FX basis mismatch | Record FX basis date and rate source in assumption log; convert all quotes on same basis |
| Undocumented yield assumption | Tie specification to yield in RFQ requirements; require yield notes and recalculate effective pricing |
| Unit mismatch (per reel vs. per ton) | Standardize to per delivered metric ton before any comparisons |
Quality Control Measures:
Benchmark accuracy degrades without systematic maintenance. Establish monthly reviews of commodity indices, quarterly assessments of regional cost differentials, and semi-annual validation of yield assumptions based on actual delivery performance.
Certain market conditions require immediate benchmark recalibration: commodity price movements exceeding historical volatility ranges, currency movements beyond normal trading ranges, freight market disruptions affecting regional competitiveness, and force majeure events impacting specific suppliers or regions.
Internal Alignment and Next Steps
The framework succeeds through cross-functional alignment on methodology, assumptions, and evaluation criteria. Finance teams gain transparent cost structures supporting budget planning and variance analysis. Logistics teams receive clear frameworks for evaluating Incoterm options and freight optimization opportunities. Operations teams understand quality assumptions and yield calculations affecting production planning and inventory management.
Implementation Roadmap:
Phase 1: Foundation Building
- Develop initial benchmark worksheet with regional cost drivers
- Document assumption methodologies and validation procedures
- Train procurement team on driver analysis and normalization techniques
- Establish cross-functional review processes for major procurement decisions
Phase 2: Integration and Optimization
- Integrate benchmarks with existing procurement systems and approval workflows
- Develop supplier communication templates explaining evaluation methodology
- Create performance tracking systems for benchmark accuracy and supplier delivery
- Expand framework to adjacent product categories and regional markets
The Reason Driver-Based Benchmarks Win
Benchmarks built on drivers are explainable. Each band carries a rationale that can be tested and replicated: fiber prints the base layer, energy shifts the slope, freight reorders the lanes, FX tilts the whole picture into your currency, and yield turns specification into the number that actually matters—effective price per usable ton to your door.
That clarity is what senior reviewers accept and what suppliers can work with. Organizations that master driver-based benchmarking gain sustainable competitive advantages in procurement effectiveness and supplier relationship management.
The transition from quote-driven to intelligence-driven procurement requires systematic implementation, but the benefits justify the analytical investment: improved decision confidence, stronger stakeholder alignment, and enhanced negotiating positions that survive scrutiny and travel well across teams.
Sources & Further Reading:
- ICC Incoterms rules — Official definitions of delivery obligations used in normalization
- U.S. International Trade Commission – HTS Search — Duty classification reference for U.S. imports
- ISO 536 — Paper and board — Determination of grammage — Standard that underpins basis weight measurements for spec-to-yield calculations
Our Editorial Process
Our expert team uses AI tools to help organize and structure our initial drafts. Every piece is then extensively rewritten, fact-checked, and enriched with first-hand insights and experiences by expert humans on our Insights Team to ensure accuracy and clarity.
About the PaperIndex Insights Team
The PaperIndex Insights Team is our dedicated engine for synthesizing complex topics into clear, helpful guides. While our content is thoroughly reviewed for clarity and accuracy, it is for informational purposes and should not replace professional advice.