
📌 Key Takeaways
Freight volatility destroys procurement decisions that look perfect on paper—but a simple stress-test matrix reveals which suppliers stay competitive when ocean rates surge.
- Winner Flips Happen Fast: A supplier offering the lowest price today can become your most expensive option within weeks when freight rates spike by 30 to 50 percent, leaving you locked into an uncompetitive contract.
- Normalize Before You Compare: Quotes in different Incoterms (EXW, FOB, CIF, DDP) hide the true landed cost—convert every offer to a single “to-door” basis so you’re comparing complete costs, not partial mill prices.
- Stress-Test Reveals Flip Points: Building a matrix that applies +30%, +40%, and +50% freight shocks to each supplier exposes the exact threshold where competitive rankings reverse, showing you which option remains stable under pressure.
- Shock Components Separately: Ocean freight and inland drayage respond to different market forces—test each independently to capture how chassis shortages or port congestion can shift costs even when ocean rates hold steady.
- Document the Decision Logic: A one-page grid showing normalized costs, stress scenarios, flip points, and qualitative factors gives finance and operations the evidence they need to approve your choice and protects you when rates move.
Stress-tested decisions withstand market turbulence instead of collapsing under it. Kraft paper procurement managers and operations leaders at converters and corrugators will find this framework essential, preparing them for the detailed normalization and stress-testing methodology that follows.
You receive three kraft paper quotes. Supplier B offers the best price. You award the contract, confident in your decision.
Three months later, ocean freight rates surge 40%. Suddenly, Supplier A—who quoted a higher mill price but ships from a closer port—delivers kraft paper to your door for less than Supplier B. Your “winning” supplier is now your most expensive option, and you’re locked into a six-month contract.
This scenario plays out more often than most procurement teams realize. The culprit isn’t poor negotiation or bad supplier selection. It’s the failure to normalize quotes to a single delivery basis and stress-test them against realistic freight volatility before making an award decision.
This guide shows you how to prevent winner flips by building a simple stress-test matrix that exposes which suppliers remain competitive even when freight rates spike by 30 to 50 percent.
Why Freight Volatility Flips Supplier Rankings
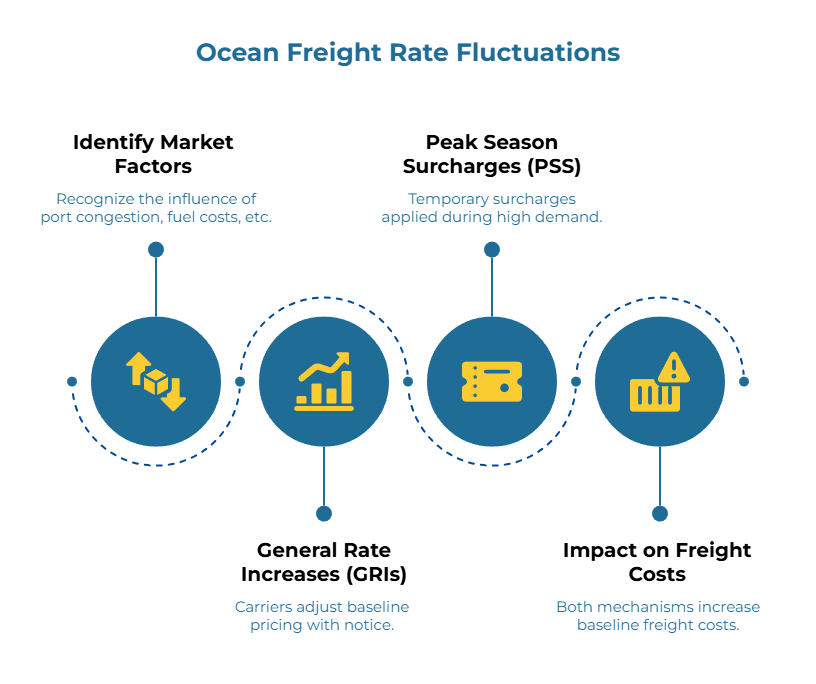
Ocean freight rates don’t move in predictable patterns. A combination of factors—port congestion, fuel costs, vessel capacity, seasonal demand, and carrier pricing strategies—creates an environment where rates can swing dramatically within a single quarter.
Two mechanisms drive these swings: General Rate Increases (GRIs) and Peak Season Surcharges (PSS). A GRI represents a carrier’s across-the-board rate adjustment, typically announced with 30 to 60 days’ notice. Carriers use GRIs to adjust their baseline pricing in response to cost pressures or market conditions, as demonstrated by carrier advisories from Hapag-Lloyd and Maersk. A PSS, by contrast, is a temporary surcharge applied during periods of high demand, such as the pre-holiday shipping rush from August through October. Both mechanisms can add 15 to 25 percent to your baseline freight cost, sometimes more.
For kraft paper buyers working with international suppliers, freight often represents 20 to 35 percent of the total landed cost. When freight rates surge, that proportion grows, and the relative cost advantage between suppliers can shift entirely. A supplier quoting EXW from Southeast Asia might look attractive at baseline freight rates, but when ocean costs spike, a supplier offering CIF from a closer origin suddenly becomes more competitive.
The risk compounds when buyers compare quotes across different Incoterms without converting them to a common delivery basis. An EXW quote looks lower than a CIF quote on paper, but the EXW quote excludes ocean freight, insurance, and destination charges—all of which you’ll pay separately and all of which are subject to volatility. If you select a supplier based on incomplete cost visibility, you’re making a decision that may not hold when market conditions change.
Converting Every Quote to a Single To-Door Basis
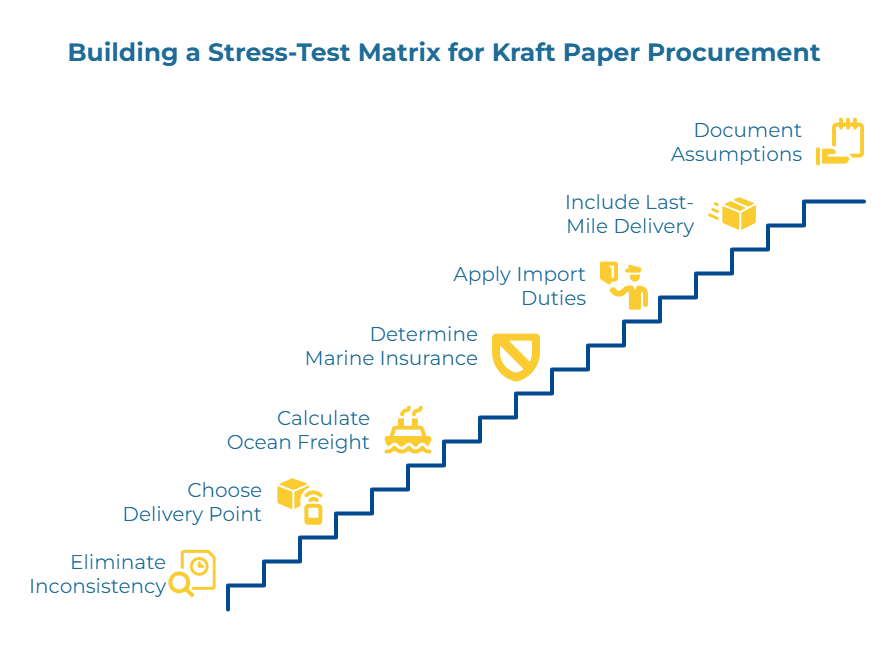
The first step in building a stress-test matrix is eliminating the Incoterm inconsistency problem. You need every supplier’s quote expressed in identical terms so you can compare true landed costs, not partial mill prices.
Choose a single target delivery point and Incoterm that reflects where and how you actually take possession of the kraft paper. For most converters and corrugators, this means defining “to-door” as DDP (Delivered Duty Paid) at your facility or CIF (Cost, Insurance, and Freight) at your nearest port. The specific choice matters less than consistency—pick one basis and convert every quote to match it.
Conversion requires four cost components:
- Ocean freight: Obtain current rates for each supplier’s origin port to your destination port. Use a neutral freight index or request quotes from multiple forwarders to establish a baseline.
- Marine insurance: Calculate the premium based on the cargo value. Standard practice is 110 percent of the invoice value, multiplied by the insurance rate for your cargo type and route.
- Import duties and taxes: Apply the correct HS code for your kraft paper grade and calculate the duty percentage on the CIF value. Add any applicable value-added tax or handling fees.
- Last-mile delivery: Include the cost to move containers from the port to your facility, whether by drayage, rail, or your own logistics.
Document every assumption you make during this conversion. Record the freight index or forwarder quote you used, the insurance rate, the duty calculation, and the last-mile cost. These assumptions will become critical when you run stress-test scenarios and when you need to explain your decision to finance or operations leadership.
Insurance Reality Check: CIP vs CIF
If you’re comparing quotes under CIF and CIP Incoterms, pay attention to the insurance coverage gap. Both terms require the seller to provide insurance, but the coverage levels differ significantly under Incoterms® 2020.
CIF requires only minimal coverage under Institute Cargo Clauses (C), which covers major casualties like sinking, fire, or collision but excludes common risks such as container damage during handling, moisture ingress, or contamination. CIP, by contrast, requires broader coverage under Institute Cargo Clauses (A), which covers all risks except those explicitly excluded. For kraft paper—especially reels sensitive to moisture and edge damage—this difference matters.
When you convert a CIF quote to your target basis, factor in the cost to upgrade the insurance to ICC (A) coverage. The incremental premium is typically small, but it ensures you’re comparing equivalent risk profiles across all suppliers. If you’re purchasing your own open cover policy externally, remove any embedded insurance costs from supplier quotes to avoid double-counting the premium in your landed cost calculation.
Building the Freight Stress-Test Matrix
Once every quote is normalized to the same delivery basis, construct a matrix that tests how each supplier’s landed cost changes under different freight scenarios. The goal is to identify which supplier remains the most cost-effective option even when ocean rates surge—and to document the specific “flip point” where supplier rankings change.
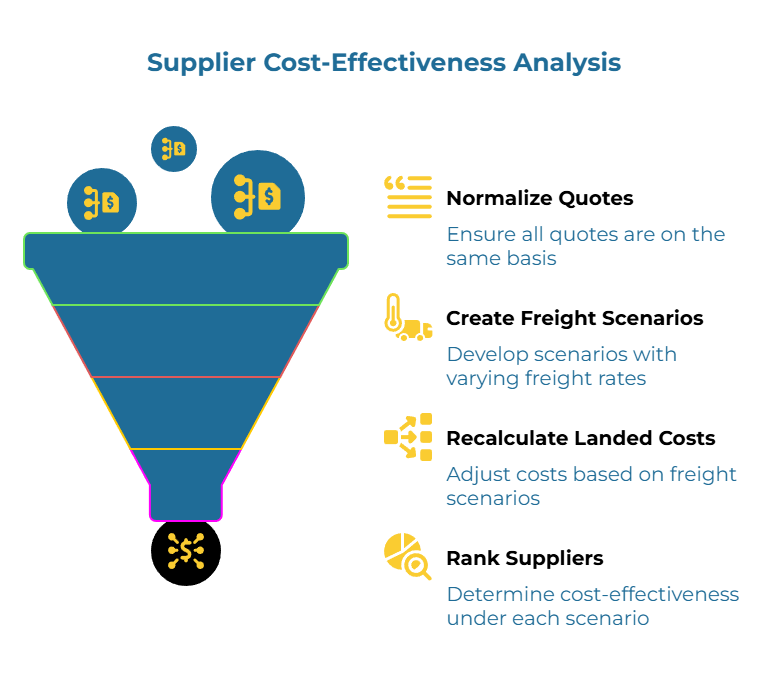
Create multiple freight scenarios for each major shipping lane:
Baseline scenario: Use current freight rates or the rates locked in at the time of quoting. This represents your starting point and the cost environment you’re likely evaluating today.
+30% scenario: Apply a 30 percent increase to the ocean freight component and inland drayage separately. This reflects a moderate GRI or a modest PSS during shoulder season.
+40% scenario: Increase ocean freight and drayage by 40 percent. This level of surge is common during peak season or when port congestion creates capacity constraints.
+50% scenario: Apply a 50 percent freight increase. While severe, this scenario has occurred during major supply chain disruptions and provides a safety margin for decision-making.
Optional downside scenarios: If freight markets are softening or you’re evaluating longer-term contracts, create −10% and −20% columns to test supplier competitiveness in falling rate environments. This reveals which suppliers maintain value across both market directions.
For each scenario, recalculate the total landed cost for every supplier. Keep the mill price, insurance, and duties constant—only the freight-sensitive components change. Shock the ocean leg and the inland drayage separately, as each responds to different market pressures (ocean capacity versus chassis and driver availability). Then rank suppliers by landed cost within each scenario.
Here’s a simplified example:
| Supplier | Origin | Baseline Landed Cost | +30% Freight | +40% Freight | +50% Freight | Flip Point |
| Supplier A | Vietnam | $850/ton | $885/ton | $902/ton | $920/ton | Stable (2nd) |
| Supplier B | Indonesia | $820/ton | $870/ton | $895/ton | $920/ton | +50% ties with A |
| Supplier C | India | $875/ton | $895/ton | $905/ton | $915/ton | +40% becomes 1st |
In this example, Supplier B appears to be the clear winner at baseline rates. However, once freight increases by 50 percent, Supplier B and Supplier A deliver identical landed costs, and Supplier C becomes competitive at the +40 percent threshold. The flip point for Supplier C—the moment it becomes the most cost-effective option—occurs at approximately +38% freight inflation. If you awarded the contract to Supplier B based solely on baseline pricing, you’re now exposed to cost parity or even a cost disadvantage if rates surge.
The matrix makes these rank flips visible before you commit. It also provides a structured way to discuss risk tolerance with your finance and operations teams. If freight rates have been stable for the past two quarters, you might accept the risk of selecting Supplier B. If market indicators show signs of tightening capacity or rising fuel costs, you might prioritize Supplier C for its stability across scenarios.
Validating Your Scenarios Against Market Benchmarks
When you sense risk building, sanity-check your ocean freight assumptions against transparent, published indicators. The Freightos Baltic Index (FBX) publishes daily container freight rates with disclosed methodology, helping you align your internal stress-test percentages with observed market trends. While these indices provide directional context rather than lane-specific quotes, they offer a reality check on whether your +30/40/50% scenarios reflect plausible market conditions or overly conservative assumptions.
Choosing Between Supplier-Managed and Buyer-Nominated Forwarders
Your choice of freight coordination model affects both cost visibility and control. Supplier-managed freight means the seller arranges ocean transport and includes it in their quote. Buyer-nominated freight means you contract directly with a forwarder and provide shipping instructions to the supplier.
Supplier-managed freight works best when the supplier has established, high-volume relationships with carriers on a proven lane. They can often secure better rates than you would independently, and they handle all booking, documentation, and coordination. The trade-off is reduced visibility—you rely on the supplier to pass through accurate freight costs, and you have less ability to switch carriers or negotiate rates if conditions change.
Buyer-nominated freight gives you direct control over carrier selection, routing, and cost. You can compare forwarder quotes, lock in rates that align with your stress-test assumptions, and switch carriers mid-contract if needed. The trade-off is operational complexity—you’re responsible for coordinating vessel schedules, container availability, and export documentation with the supplier. For buyers managing multiple suppliers or lanes, this can strain internal resources.
For most kraft paper procurement scenarios, a hybrid approach offers the best balance. Use supplier-managed freight for proven lanes with stable suppliers who demonstrate transparent pricing. Use buyer-nominated freight for new suppliers, high-volatility lanes, or situations where you need to lock in specific freight rates to match your stress-test model.
Documenting Your Decision and Securing Sign-Off
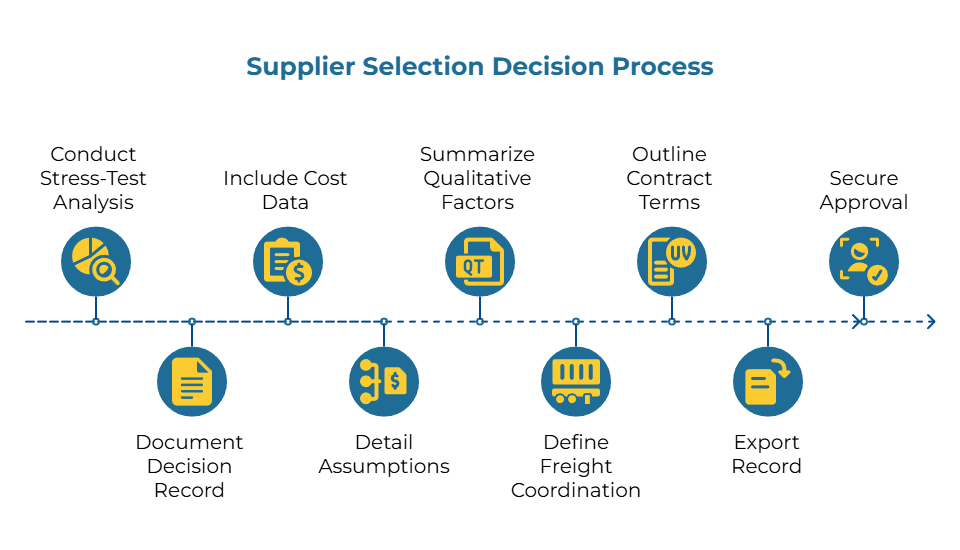
A stress-test matrix is only valuable if the decision it informs is documented and approved by the relevant stakeholders. Build a decision record that captures the full analysis and the rationale for your final supplier selection.
Your decision record should include:
- The normalized to-door costs for every supplier at baseline rates
- The recalculated costs under each stress-test scenario (+30%, +40%, +50%)
- The assumptions behind every cost component (freight index, insurance rate, duty calculation, last-mile estimate)
- The rank changes across scenarios and the specific flip points where supplier competitiveness reverses
- A one-sentence summary of qualitative factors (lead time reliability, quality consistency, claims history)
- The freight coordination model (supplier-managed or buyer-nominated) for the selected supplier
- The contract terms that lock in or protect against freight volatility (fixed rates, rate adjustment clauses, or re-opener provisions)
Export this record as a single-page grid or summary table that finance, quality assurance, and operations can review quickly. Secure explicit sign-off from procurement leadership and any cross-functional stakeholders with budget authority or supply risk accountability. This documented approval protects you if freight rates do surge—you’ve demonstrated due diligence, stress-tested the decision, and secured leadership buy-in before committing.
Practical Considerations That Affect Real Costs
Beyond the core stress-test framework, several operational details can shift your landed cost calculations in ways that aren’t immediately obvious:
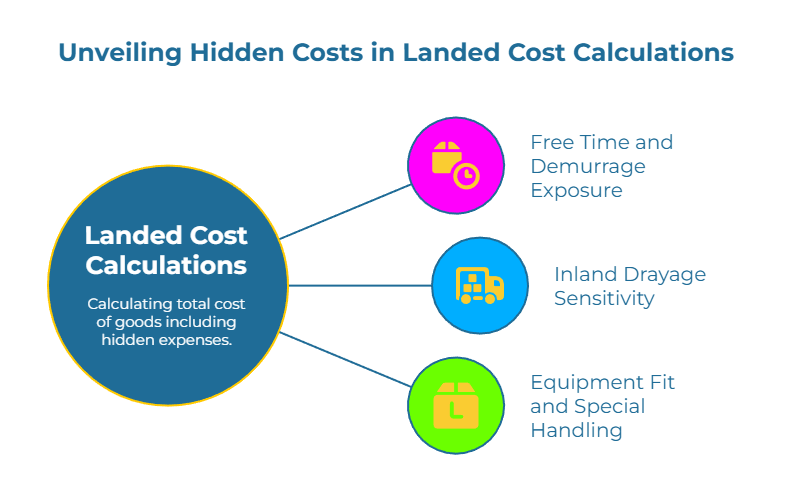
Free time and demurrage exposure: Two extra days of free container time at the destination port can offset a small rate difference during periods of congestion. When comparing quotes, verify the free time allowance included in each offer and treat demurrage and detention assumptions as scenario inputs. A supplier offering longer free time provides a buffer against port delays that might otherwise generate unexpected fees.
Inland drayage sensitivity: The last-mile leg from port to your facility can swing independently of ocean rates, driven by chassis availability, driver shortages, and local fuel costs. When building your stress-test matrix, shock the drayage component separately from the ocean leg to reflect these distinct market dynamics. A 30% ocean surge doesn’t necessarily mean a 30% drayage increase, and treating them as one blended figure can distort your scenarios.
Equipment fit and special handling: If your kraft paper specifications require heavy reels, protective dunnage, or specific container configurations, verify these assumptions with every supplier before finalizing your matrix. Unexpected special handling fees—like charges for over-weight containers or non-standard loading—can dwarf small rate differences and invalidate your baseline comparison.
Frequently Asked Questions
How often should you refresh the stress-test analysis?
For active contracts, quarterly reviews work well in stable freight markets. Tighten the cadence to monthly during peak season (typically August through October) or when you observe sustained GRI announcements from multiple carriers. The goal is to catch deteriorating conditions before they force a mid-contract renegotiation.
Where can you verify the current market direction?
Use published benchmarks like the FBX methodology page for context on index construction and directional trends. Cross-reference with carrier advisories on GRI and PSS announcements from Hapag-Lloyd and Maersk. Remember that indices provide directional signals, not lane-specific quotes, so validate assumptions with your forwarders before applying them to your matrix.
Do GRIs and PSS apply to every booking?
Not universally. Carriers announce GRIs by trade route and sometimes by equipment type. A GRI for Asia-North America eastbound trades may not affect your shipments from Europe or South America. Always confirm applicability to your specific lane and contract type before assuming a published GRI will impact your costs. If you have a service contract with fixed rates, many GRIs won’t apply until your contract renews.
Freight volatility will continue to create risk in kraft paper procurement. The solution isn’t to avoid international suppliers or overpay for perceived stability. The solution is to normalize every quote to a single delivery basis, stress-test your shortlist against realistic rate surges, and document the trade-offs before you award the contract.
When you build this discipline into your RFQ process, you stop reacting to freight spikes and start planning for them. The supplier who wins your business will remain competitive even when ocean rates climb—because you’ve already tested that scenario and chosen accordingly.
Ready to source kraft paper with confidence? Submit your RFQ on PaperIndex to connect with verified suppliers, or explore our kraft paper supplier directory to compare capabilities across multiple origins and shipping lanes. Build your sourcing expertise with practical tutorials from the PaperIndex Academy.
Disclaimer: This article provides educational guidance on procurement methodology and freight risk management. Actual freight rates, insurance costs, and duty calculations vary by route, cargo type, and market conditions. Always validate current rates with forwarders and customs brokers before making supplier commitments.
Our Editorial Process
Our expert team uses AI tools to help organize and structure our initial drafts. Every piece is then extensively rewritten, fact-checked, and enriched with first-hand insights and experiences by expert humans on our Insights Team to ensure accuracy and clarity.
About the PaperIndex Insights Team
The PaperIndex Insights Team is our dedicated engine for synthesizing complex topics into clear, helpful guides. While our content is thoroughly reviewed for clarity and accuracy, it is for informational purposes and should not replace professional advice.