📌 Key Takeaways
Cash flow problems aren’t always caused by poor sales—they’re often caused by poor timing between when you pay suppliers and when customers pay you.
- The Gap Is Measurable: Working capital strain from payment terms is the number of days between paying kraft paper suppliers and collecting from customers, and it can be calculated using three simple metrics—supplier payment days, inventory days, and customer payment days.
- Small Changes Release Big Cash: Extending supplier terms by 10 days, reducing inventory by 5 days, or accelerating customer collections by 10 days can each free tens or hundreds of thousands of dollars from your operating cycle without requiring new financing.
- One Page Beats Gut Feel: A simple cash conversion cycle worksheet transforms scattered financial data into a shared map that owners, finance heads, and procurement managers can use to make deliberate decisions instead of reactive compromises.
- Three Lever Families Control the Gap: Supplier-side levers (payment terms), internal operations levers (inventory management), and customer-side levers (collection speed and financing) each offer distinct ways to shrink or safely fund the cash gap.
- Design Problem, Not Personal Failure: Payment terms and working capital requirements are adjustable design choices, not fixed constraints, and treating them as such shifts conversations from firefighting to systematic improvement.
Map it once, measure it quarterly, adjust one lever at a time—that’s how converters move from overdraft anxiety to cash control.
SME packaging converters struggling with persistent overdraft pressure will find a practical framework here, preparing them for the detailed step-by-step worksheet and implementation guidance that follows.
The warehouse holds three weeks’ worth of kraft paper. Your supplier’s invoice is due Friday. Meanwhile, your largest customer still hasn’t paid for last month’s shipment, and the overdraft facility is pushing 85% utilization.
This tension isn’t unusual for small packaging converters. Sales are healthy, orders are steady, yet cash feels perpetually tight. The root cause isn’t poor management or bad customers—it’s a structural timing gap built into how kraft paper trading works.
Working capital strain from payment terms occurs when you must pay suppliers before customers pay you. This gap—typically 30 to 90 days—locks working capital into inventory and receivables. For a converter processing $500,000 monthly in kraft paper, a 60-day gap means roughly $1 million constantly tied up in the operating cycle.
This article shows you how to map that gap on a single page, translate it into actual cash requirements, and decide which operational levers to adjust first. The method requires basic financial data you already have and can be completed in under two hours.
The Core Answer: How to See and Fix Your Cash Flow Gap
Map your cash conversion cycle by calculating how long kraft paper suppliers wait for payment, how long material sits in inventory, and how long customers take to pay you. The simplified formula is: add inventory days plus customer payment days, then subtract supplier payment days. The result shows how many days of cash you must fund. Multiply those days by your average daily kraft paper outlay to see the dollar amount. Then adjust one lever at a time—negotiate longer supplier terms, reduce inventory days, or tighten customer payment periods—to shrink the gap and ease overdraft pressure.
Why Good Sales Still Feel Like a Cash Struggle
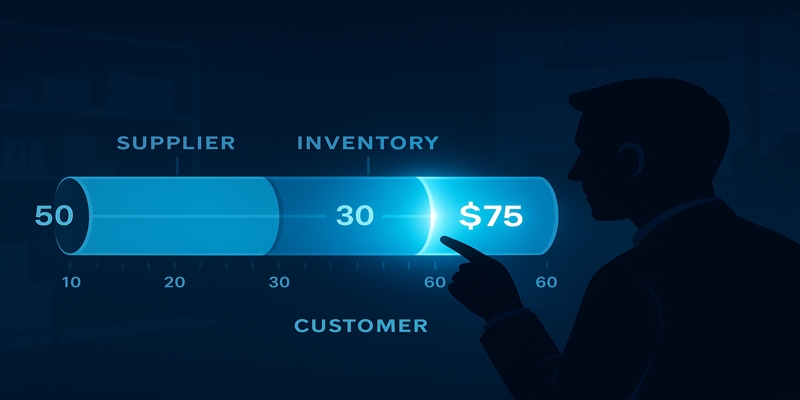
Picture a typical month at a mid-sized packaging plant. Raw material inventory averages $150,000. Kraft paper suppliers typically expect payment on tighter terms than downstream customers, often within 15 to 30 days of delivery. Your customers—mostly food manufacturers and e-commerce fulfillment operations—often use their purchasing leverage to negotiate extended payment terms, typically ranging from 45 to 60 days.
You’re not losing money on sales. Margins are adequate. Production runs smoothly. Yet the overdraft facility hovers near its limit month after month, and conversations with your bank feel increasingly uncomfortable.
This pattern emerges from a fundamental mismatch in payment timing. You’re funding the entire paper purchasing, storage, converting, and shipping cycle primarily from borrowed money or equity. The cash required to settle supplier invoices leaves your account weeks before customer payments arrive to replenish it.
For converters without substantial equity reserves, this timing gap creates persistent liquidity stress. Banks scrutinize coverage ratios. Suppliers occasionally withhold shipments when payments run late. Every negotiation with a customer over payment terms feels high-stakes because a five-day shift can materially affect your cash position.
The challenge isn’t that your business model is broken. It’s that you’re operating without a clear view of where cash is stuck and which adjustments would provide the most relief. This is a design problem, not a personal failure—and it can be mapped, measured, and systematically improved.
What Working Capital Strain from Payment Terms Actually Means
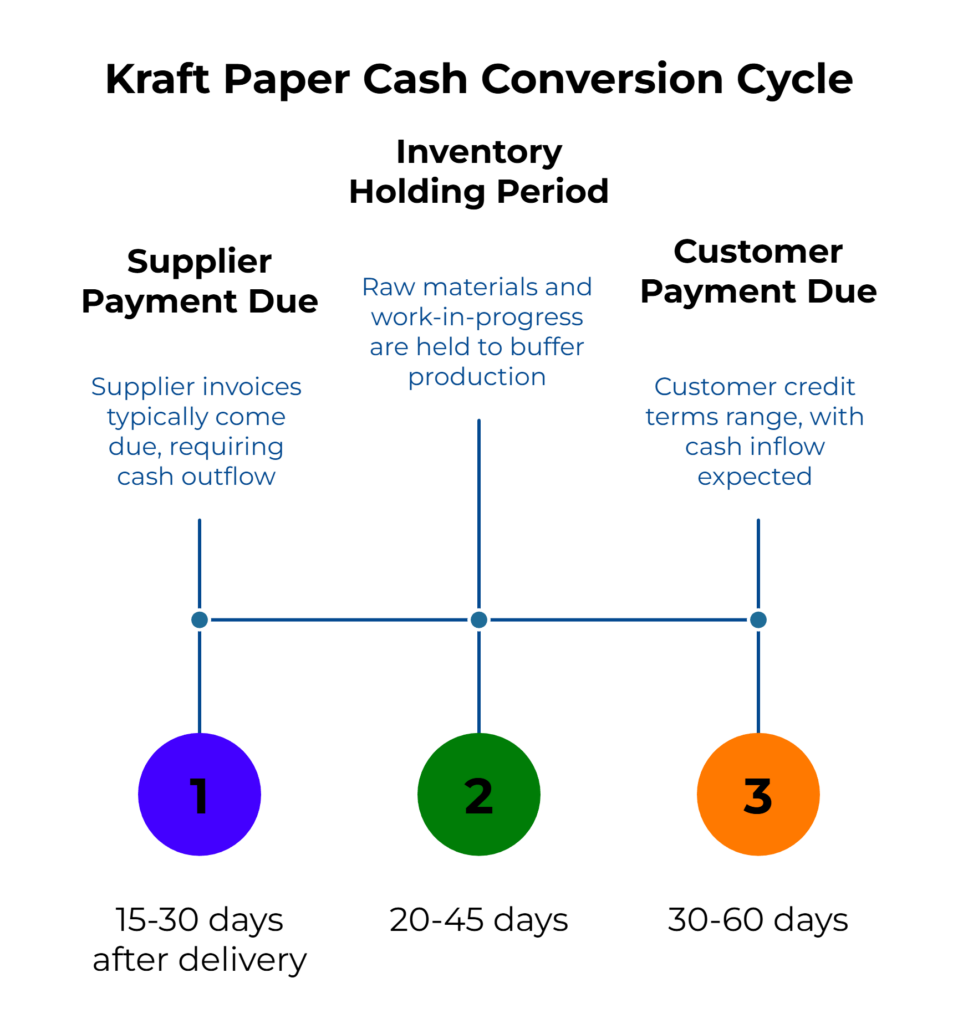
Working capital strain from payment terms is the period between settling supplier invoices and collecting customer payments. During this window, your cash finances three distinct activities:
Supplier payment obligations typically come due 15 to 30 days after delivery. Some kraft paper mills offer early payment incentives—such as the common ‘2/10 net 30’ structure (2% off for settlement within 10 days)—which can create pressure to pay even faster. Others require cash on delivery or advance payment for new customers.
Inventory holding periods vary by production scheduling and order patterns. Even well-managed converters typically maintain 20 to 45 days of raw material and work-in-progress (depending on supply chain stability) to buffer against disruptions and maintain production continuity.
Customer credit terms commonly range from 30 to 60 days for established relationships, though large kraft paper buyers sometimes negotiate 90-day terms. Collection enforcement varies—some converters allow payment drift, while others rigorously follow up after the due date.
The cash conversion cycle (CCC) formula captures this sequence. Financial education resources typically define it as the time required to convert cash paid to suppliers into cash collected from customers, calculated as:
CCC = Inventory Days + Receivable Days − Payable Days
For kraft paper specifically, this translates to a simplified gap formula:
Cash Gap (days) = Inventory Days + Customer Payment Days − Supplier Payment Days
A positive gap means you’re funding the shortfall. A negative gap means customer cash arrives before supplier obligations fully mature—a favorable position, but rare for small converters with limited negotiating leverage.
The cash impact scales directly with purchase volume. A converter buying $600,000 monthly in kraft paper operates at roughly $20,000 daily. A 50-day gap requires $1 million in working capital constantly committed to the operating cycle. That capital must come from somewhere—overdraft facilities, term loans, shareholder equity, or retained earnings.
Understanding this mechanism transforms working capital from an abstract financial concept into a concrete operational parameter you can measure and adjust.
The Cash Conversion Cycle Map for Kraft Paper
The CCC framework links three time-based measurements into a single diagnostic tool. Each component quantifies a distinct phase of your operating cycle.
Days Payable Outstanding (Supplier Payment Days)
This measures how long you take to settle kraft paper invoices after receiving material. Calculate it using your average payables balance and total purchases over a representative period:
Supplier Payment Days = (Average Kraft Paper Payables / Total Kraft Paper Purchases) × Number of Days
If your payables ledger shows an average balance of $120,000 over the past quarter and you purchased $1.2 million during those 90 days:
Supplier Payment Days = ($120,000 / $1,200,000) × 90 = 9 days
This indicates you’re settling invoices quickly—perhaps to capture early payment discounts or because credit terms are tight.
Days Inventory Outstanding (Inventory Days)
This measures how long kraft paper sits as raw material or work-in-progress before converting and shipping to customers. Use your average inventory value and monthly purchase rate:
Inventory Days = (Average Kraft Paper Inventory / Monthly Purchases) × 30
If inventory averages $200,000 and monthly purchases run $500,000:
Inventory Days = ($200,000 / $500,000) × 30 = 12 days
This represents a lean inventory position—you’re turning material quickly, which minimizes holding costs but may leave little buffer against supply disruptions. Authoritative accounting sources note this calculation provides a directional estimate; precision improves as you refine your data collection over time.
Days Sales Outstanding (Customer Payment Days)
This measures how long customers take to pay after you deliver finished goods. Calculate using your receivables balance and monthly sales:
Customer Payment Days = (Average Receivables / Monthly Sales) × 30
If receivables average $900,000 and monthly kraft-paper-related sales are $600,000:
Customer Payment Days = ($900,000 / $600,000) × 30 = 45 days
This aligns with typical net-45 terms but indicates customers are taking the full period rather than paying early.
Computing Your Cash Conversion Cycle
Combine the three measurements using the simplified gap formula:
Cash Gap = Inventory Days + Customer Payment Days − Supplier Payment Days
Using the example figures:
Cash Gap = 12 days (inventory) + 45 days (customer) − 9 days (supplier) = 48 days
This means you’re funding 48 days of operations. At $16,667 daily kraft paper outlay (assuming $500,000 monthly purchases):
Cash Requirement = 48 days × $16,667/day = $800,000
That’s $800,000 in working capital continuously locked in the cycle—a figure that must be financed through overdrafts, term loans, or equity.
More commonly, converters face scenarios where variables move against them simultaneously. If supplier payment days drop to 0 (immediate settlement), inventory rises to 35 days (production scheduling issues), and customer payment days extend to 70 (large buyer negotiates longer terms):
Cash Gap = 35 + 70 − 0 = 105 days
At $20,000 daily kraft paper outlay:
Cash Requirement = 105 days × $20,000/day = $2,100,000
The converter now needs over $2 million in working capital to sustain the cycle—a dramatic increase driven by seemingly modest shifts in each variable.
Your Working Capital Strain Worksheet
The following worksheet provides a structured method for calculating your kraft paper cash conversion cycle using data from your accounting system or ERP. Plan to spend 60 to 90 minutes gathering information and completing the calculations.
Preparation: Gather Source Data
You’ll need figures from a recent, representative period—typically the last full quarter (90 days) or the past six months. Collect:
- Total kraft paper purchases (sum of all supplier invoices paid or accrued)
- Average kraft paper payables balance (snapshot at month-end or calculate average of beginning and ending balance)
- Average kraft paper inventory value (raw material plus work-in-progress directly tied to kraft paper)
- Monthly kraft paper sales (revenue from products using kraft paper as primary input)
- Average customer receivables tied to kraft paper sales (if you can’t separate precisely, use total receivables and adjust proportionally)
Also note your supplier payment terms (contractual) and actual average payment timing (from bank statements). Directionally correct numbers are sufficient for this first pass—precision can be refined over time.
Step 1: Calculate Supplier Payment Days
Use the formula:
Supplier Payment Days = (Average Payables / Total Purchases) × Number of Days in Period
Example:
Average payables: $150,000
Quarterly purchases: $1,500,000
Period: 90 days
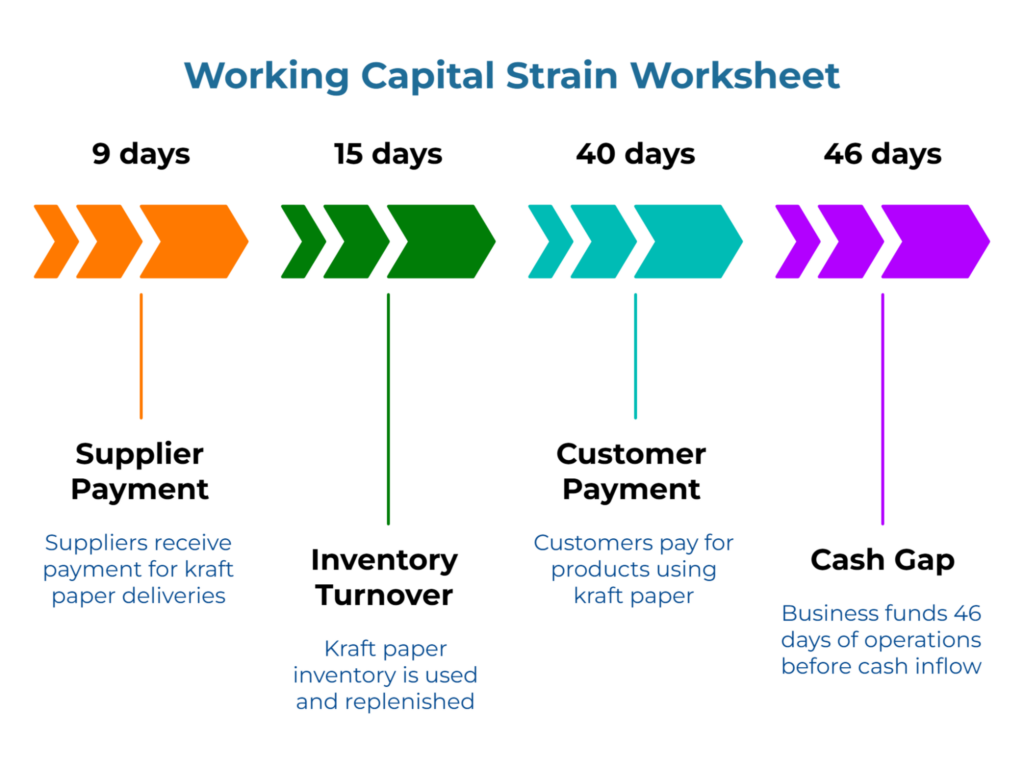
Supplier Payment Days = ($150,000 / $1,500,000) × 90 = 9 days
This tells you suppliers are receiving payment roughly 9 days after delivery, suggesting either aggressive early payment discount capture or very tight credit terms.
Step 2: Calculate Inventory Days
Use the formula:
Inventory Days = (Average Inventory / Monthly Purchases) × 30
Example:
Average inventory: $250,000
Monthly purchases: $500,000
Inventory Days = ($250,000 / $500,000) × 30 = 15 days
This indicates lean inventory management—material turns over approximately every two weeks.
Step 3: Calculate Customer Payment Days
Use the formula:
Customer Payment Days = (Average Receivables / Monthly Sales) × 30
Example:
Average receivables: $800,000
Monthly sales: $600,000
Customer Payment Days = ($800,000 / $600,000) × 30 = 40 days
Customers are taking approximately 40 days to pay, which falls within typical net-45 terms but leaves no early-payment buffer.
Step 4: Compute Your Cash Conversion Cycle
Cash Gap = Inventory Days + Customer Payment Days − Supplier Payment Days
Using the example figures:
Cash Gap = 15 + 40 − 9 = 46 days
This shows you’re funding 46 days of operations before customer cash fully replenishes supplier payments.
Step 5: Translate Days into Cash Requirements
Calculate your daily kraft paper outlay:
Daily Outlay = Monthly Purchases / 30
If monthly purchases average $500,000:
Daily Outlay = $500,000 / 30 = $16,667
Multiply by your cash gap:
Cash Requirement = Cash Gap (days) × Daily Outlay
Cash Requirement = 46 days × $16,667/day = $766,682
You need roughly $767,000 in working capital continuously committed to fund this gap. This comes from overdraft facilities, term loans, or equity.
Worked Example: Before and After Scenarios
Scenario A: Current State
- Supplier payment days: 15 (settling quickly to preserve relationships)
- Inventory days: 30 (moderate buffer against supply disruptions)
- Customer payment days: 50 (typical net-45 with some drift)
Cash Gap = 30 + 50 − 15 = 65 days
At $18,000 daily outlay, this requires $1,170,000 working capital.
Scenario B: After One Large Customer Extends Terms
Same parameters except customer payment days stretch to 70 (large buyer negotiates net-60 with additional drift):
Cash Gap = 30 + 70 − 15 = 85 days
Now the gap is $1,530,000 ($18,000 × 85), an increase of $360,000 driven by a single customer’s term extension.
Scenario C: After Negotiating Supplier Terms
You negotiate 30-day terms with your primary mill, moving supplier payment days from 15 to 30:
Cash Gap = 30 + 70 − 30 = 70 days
The gap drops to $1,260,000—still significant, but $270,000 less than Scenario B. This demonstrates the tangible impact of one successful negotiation.
Reading Your Map and Choosing Levers
Once you’ve calculated your cash gap and cash requirement, the next decision is which operational lever to adjust. Your options naturally group into three lever families, each containing multiple adjustment mechanisms.
Three Lever Families for Managing the Gap
The levers that shape your cash conversion cycle fall into three categories:
Family 1: Supplier-Side Levers focus on how and when you pay for kraft paper.
Family 2: Internal Operations Levers focus on how long material sits before conversion and sale.
Family 3: Customer-Side and Financing Levers focus on when cash returns and how you bridge any remaining gap.
Within these families, you have specific mechanisms to deploy:
Lever 1: Extend Supplier Payment Terms
Objective: Increase Days Payable Outstanding to reduce the cash you must fund.
Mechanism: Negotiate longer credit periods with kraft paper mills. Moving from net-15 to net-30 adds 15 days of supplier financing to your favor.
Trade-offs: Mills may charge higher prices for extended terms, require additional creditworthiness documentation, or offer fewer volume discounts. Some provide early payment discounts (2% for 10-day settlement) that you’d forfeit by extending terms.
Best for: Converters with strong creditworthiness and established supplier relationships who can negotiate from a position of reliability rather than desperation. Most effective when inventory and customer payment days are already optimized.
Family: Supplier-Side Levers
Lever 2: Reduce Inventory Days
Objective: Decrease Days Inventory Outstanding to free trapped cash.
Mechanism: Shift to smaller, more frequent kraft paper orders. Improve production scheduling to minimize raw material dwell time. Tighten the gap between material receipt and conversion.
Trade-offs: Smaller orders may increase per-ton freight costs or reduce volume discounts. More frequent deliveries require reliable mill supply and tighter coordination. Lean inventory leaves less buffer against supply disruptions or unexpected order surges.
Best for: Converters with predictable production schedules, reliable supplier lead times, and proximity to mills that enables cost-effective frequent delivery. Most impactful when inventory currently exceeds 30 days.
Family: Internal Operations Levers
Lever 3: Shorten Customer Payment Terms
Objective: Decrease Days Sales Outstanding to accelerate cash inflows.
Mechanism: Negotiate shorter payment periods (move from net-60 to net-45 or net-30). Offer small early-payment discounts (1-2% for 10-day settlement). Enforce payment terms more rigorously with late-payment fees or holds on future shipments.
Trade-offs: Large customers resist term changes and may source from competitors offering longer credit. Aggressive enforcement risks damaging relationships. Early-payment discounts reduce margin.
Best for: Converters with differentiated products, strong service quality, or relationships where value justifies tighter terms. Most effective with mid-sized customers who lack leverage to demand extended credit.
Family: Customer-Side and Financing Levers
Lever 4: Secure Short-Term Financing
Objective: Fund the gap through external capital rather than operational changes.
Mechanism: Increase overdraft facility limits, arrange working capital term loans, or use invoice discounting (where a lender advances 70-90% of invoice value immediately).
Trade-offs: Interest costs for unsecured overdrafts and term loans vary by economic climate and creditworthiness, often ranging from prime plus a significant margin (commonly totaling 8–15% annually in standard rate environments). Invoice discounting fees run 1-3% of invoice value. All require collateral and proof of stable cash flows. Adds debt service obligations.
Best for: Converters where operational levers (supplier terms, inventory, customer credit) are already optimized or where changing them would harm competitive position. Also appropriate for short-term liquidity crunches while implementing longer-term operational improvements.
Family: Customer-Side and Financing Levers
Lever 5: Internal Alignment and Regular Monitoring
Objective: Ensure all decision-makers work from the same cash conversion cycle map and track changes systematically.
Mechanism: Share the completed worksheet with ownership, finance, and procurement. Establish quarterly review meetings to track changes after each operational adjustment. Update the worksheet immediately after renegotiating supplier or customer terms.
Trade-offs: Minimal—this is about visibility and coordination rather than new costs. Requires discipline to maintain regular review cadence.
Best for: All converters, regardless of current cash gap position. This creates the foundation for all other lever adjustments by ensuring everyone understands the cash impact of operational decisions.
Family: Spans all three families as an enabling mechanism
Prioritization Framework
If your cash gap exceeds 60 days: Focus first on supplier term extensions or inventory reduction. Even a 10-day improvement releases significant cash and reduces overdraft stress.
If your cash gap ranges from 30 to 60 days: Customer payment terms become the priority. A 5-day reduction from faster collections can materially improve liquidity without requiring supplier or inventory changes.
If your cash gap is below 30 days: You’re in a relatively strong position. Maintain current practices and use any surplus to reduce debt, build reserves, or invest in capacity improvements that further strengthen your competitive position.
If multiple levers need adjustment: Tackle them sequentially rather than simultaneously. Start with the lever offering the highest cash release per unit of effort. Track results for 60-90 days before implementing the next change.
Aligning Owners, Finance, and Procurement Around the Same Map
In most converting operations, the three key functions see working capital from different perspectives:
Owners worry about growth, sales momentum, and maintaining the overall banking relationship. Their natural focus is revenue expansion and customer satisfaction.
Finance heads watch overdraft utilization, prepare for limit renewals, and field calls from bank relationship managers. Their concern centers on liquidity coverage and debt service capacity.
Procurement managers focus on securing material, maintaining supplier goodwill, and preventing stock-outs that would shut down production lines. Their priority is supply continuity.
Without a neutral, shared artifact, discussions about working capital easily become emotional or feel personal. Finance pushes for tighter inventory. Procurement resists because they fear disrupting production. Owners want both functions to “figure it out” without clear guidance on trade-offs.
The cash conversion cycle map changes this dynamic. It creates a single page where all three functions see the same numbers—supplier days, inventory days, customer days, and the resulting cash requirement. Each function can see how its decisions affect the shared gap.
This visibility enables combined moves. For example: a 10-day supplier term extension (procurement’s relationship), plus a 5-day inventory reduction on two high-volume grades (operations’ scheduling), plus slightly tighter follow-up with mid-sized customers (sales and finance cooperation). The worksheet shows the cumulative impact before committing to any single change.
Over time, the organization’s identity shifts from “a plant that manages cash by instinct and firefighting” to “a plant that runs cash with a clear map and deliberate design choices.”
Seven-Day Implementation Plan
Day 1: Pull financial reports. Extract kraft paper purchases, payables, inventory, sales, and receivables for the last 90 days from your accounting system or ERP.
Day 2: Calculate component metrics. Work through Steps 1-3 of the worksheet to determine Supplier Payment Days, Inventory Days, and Customer Payment Days.
Day 3: Complete the cash gap calculation and translate to cash. Use Steps 4-5 to compute your cycle time and dollar requirement.
Day 4: Share the one-page map. Present findings to the ownership and finance head. Ensure everyone understands each component and agrees on the total cash requirement. Print copies or share a PDF that can be referenced in future discussions.
Day 5: Identify your priority lever family. Based on the prioritization framework, decide whether to focus on supplier terms, inventory days, customer credit, or financing. Choose one specific target within that family (e.g., extend one key supplier from net-15 to net-30, or reduce inventory days on three major grades by 10 days).
Day 6: Initiate the first action. If supplier terms are the priority, schedule a call with your primary mill to discuss credit extension. If inventory is the focus, meet with production planning to identify opportunities for tighter scheduling. Document the specific change you’re testing.
Day 7: Schedule a 30-day review. Set a follow-up meeting to measure whether the adjustment reduced your cash gap and improved overdraft utilization. Commit to updating the worksheet with actual results rather than assumptions.
Frequently Asked Questions
Can this method work if I source from multiple mills and carry various kraft paper grades?
Yes. Aggregate all kraft paper purchases, payables, and inventory regardless of grade or supplier. The worksheet provides a composite view of total kraft paper working capital. If you need grade-specific insight later—for example, to prioritize which supplier to negotiate with first—run separate worksheets for each major grade or supplier relationship.
What if customer payment timing varies significantly across my buyer base?
Calculate a weighted average based on revenue contribution. If 60% of kraft paper sales come from customers who pay in 40 days and 40% from customers who pay in 65 days:
Average Customer Payment Days = (0.60 × 40) + (0.40 × 65) = 50 days
This provides a reasonable composite figure for the worksheet. For strategic decisions about which customer relationships to prioritize for term renegotiation, track each major customer’s payment performance individually.
How frequently should I update this worksheet?
Quarterly updates capture most operational changes without creating excessive administrative burden. Update immediately after major events: new supplier contracts, significant changes in inventory policy, large customer term renegotiations, or material shifts in order patterns.
Is this the same as cash flow forecasting?
No. Cash flow forecasting projects specific future inflows and outflows week by week, typically looking 8-13 weeks ahead. The cash conversion cycle worksheet is a diagnostic tool showing the structural cash requirement created by payment term mismatches. Both serve valuable but distinct purposes. The CCC map helps you understand why you need working capital; cash flow forecasting helps you manage when specific payments will hit your account.
What defines a “good” cash gap for packaging converters?
Industry benchmarks vary widely based on scale, customer mix, and regional payment norms. Smaller converters with limited negotiating leverage commonly operate at 40-80 day cycles. Larger operations with better terms might achieve 20-40 day cycles. The goal isn’t to match an external benchmark but to understand your own position, identify which lever offers the most improvement potential, and systematically work to optimize your cycle.
Should I share this analysis with my bank?
Absolutely. Banks value clients who demonstrate understanding of their working capital drivers and actively manage liquidity. Presenting a clear cash conversion cycle map during credit reviews or limit increase requests shows financial discipline. It also provides objective justification for overdraft or working capital loan requests by demonstrating the structural cash requirement rather than simply stating “we need more credit.”
What if my calculation shows a favorable gap but I still feel cash-strapped?
A low average cash gap doesn’t guarantee smooth daily liquidity. Payment timing mismatches create short-term stress even when the overall cycle looks manageable. Supplier invoices bunch around delivery dates while customer payments arrive unpredictably. Consider running weekly cash flow projections alongside the CCC map to identify specific periods when payments diverge from the average pattern.
Where can I learn more about cash conversion cycle concepts?
Financial education platforms provide comprehensive explanations of CCC mechanics, calculation methods, and interpretation. These resources offer additional context on working capital management principles that complement this practical guide.
From Reactive to Deliberate: Taking Control of Your Cash Position
Three months ago, working capital felt like an unsolvable constraint. Supplier calls created anxiety. Bank meetings felt defensive. Every customer negotiation over payment terms carried high stakes because you couldn’t clearly articulate the cash impact.
Now you have a simple, shared map showing exactly where cash is locked—how many days suppliers wait for payment, how long material sits in inventory, how long customers take to pay. The 46-day gap you calculated (or 65 days, or 85 days) isn’t a mystery anymore. It’s a measurable parameter you can discuss with mills, customers, and banks using the same numbers and vocabulary.
The shift from reactive firefighting to calm, map-driven planning doesn’t require sophisticated software or advanced finance training. It starts with making the invisible visible. Once ownership, finance, and procurement see the same cash conversion cycle timeline, conversations about supplier credit negotiations, inventory policy, and customer payment terms transform from emotional debates into practical design exercises.
Working capital strain from kraft paper payment terms can be reduced when converters deliberately map and adjust their cash conversion cycle to achieve a more stable cash position and less overdraft stress. Your kraft paper working capital is no longer an abstract financial burden you endure. It’s a structure you can measure, monitor, and methodically improve—one lever at a time.
Disclaimer: This article provides educational guidance on working capital management concepts for packaging industry professionals. It does not constitute financial, accounting, or legal advice. Working capital requirements, payment terms, credit policies, and financing options vary significantly by business circumstances, jurisdiction, and relationship dynamics. The calculations and examples presented illustrate general principles but may not reflect your specific situation. Before implementing changes to supplier payment arrangements, customer credit terms, inventory policies, or financing strategies, consult with qualified financial advisors, accountants, or legal professionals who understand your particular operational and financial context.
Our Editorial Process
Our expert team uses AI tools to help organize and structure our initial drafts. Every piece is then extensively rewritten, fact-checked, and enriched with first-hand insights and experiences by expert humans on our Insights Team to ensure accuracy and clarity.
About the PaperIndex Insights Team
The PaperIndex Insights Team is our dedicated engine for synthesizing complex topics into clear, helpful guides. While our content is thoroughly reviewed for clarity and accuracy, it is for informational purposes and should not replace professional advice.