
📌 Key Takeaways
Choosing between manufacturers and converters isn’t about finding the cheapest quote—it’s about matching supplier capabilities to your demand profile, risk tolerance, and operational requirements.
- Cost-to-Door Normalization Reveals True Economics: Converting all quotes to a single delivered basis—accounting for freight, insurance, duties, and handling—exposes which supplier actually costs less once goods reach your facility.
- Spec Alignment Prevents Hidden Losses: Tolerance differences and test method mismatches create yield loss, equipment downtime, and customer claims that turn attractive quotes into expensive relationships.
- Reliability Metrics Predict OTIF Performance: Lead time standard deviation under 5 days, rollover rates below 3%, and documentation accuracy above 95% are leading indicators of suppliers who deliver when promised.
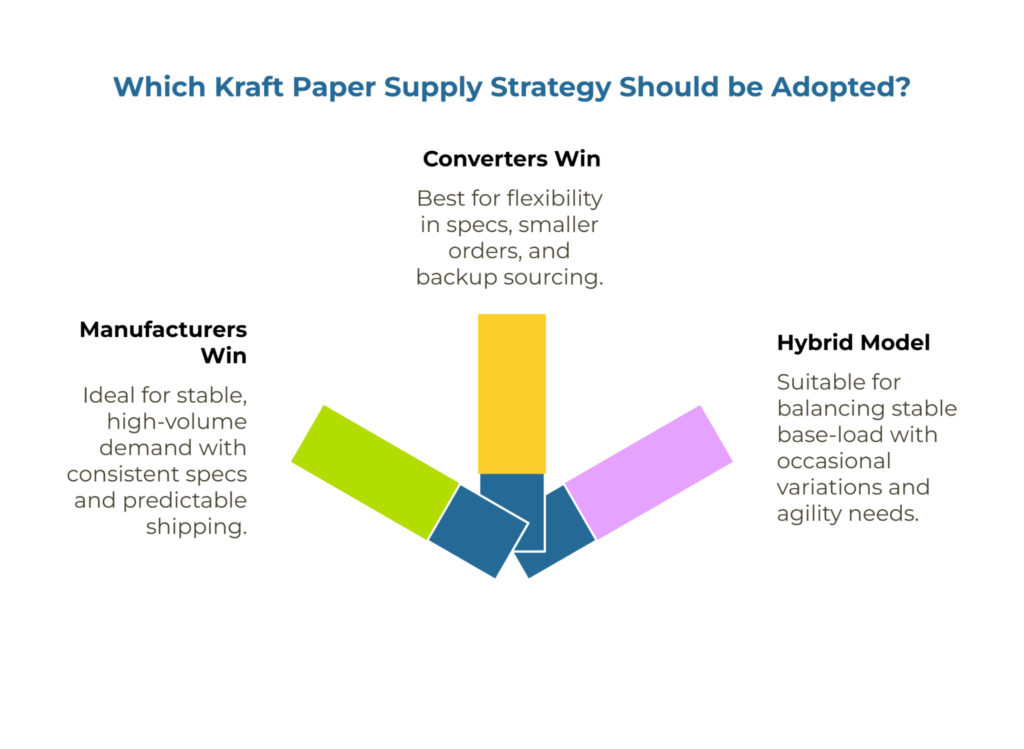
- Mills Win on Stability, Converters Win on Agility: High-volume, spec-locked buyers benefit from mill economics and process visibility; variable-demand buyers need converter flexibility and backup lanes.
- Hybrid Models Capture Both Advantages: Allocating 60-70% of stable base-load volume to mills while routing peaks and special specs through converters delivers cost predictability with operational flexibility.
Evidence-based scorecards beat gut decisions every time.
Procurement managers, supply chain directors, and operations teams sourcing kraft paper internationally will find the systematic evaluation framework here, preparing them for the detailed comparison methodology that follows.
Deciding between buying kraft paper directly from manufacturers or through converters isn’t a simple price comparison. The question cuts deeper into how your supply chain handles risk, maintains quality consistency, and responds when demand patterns shift or disruptions hit.
Most procurement teams default to chasing the lowest quote. That’s understandable—cost pressure is real. But here’s what actually matters: the partner type you choose determines your total landed cost, your exposure to rollover risk, the accuracy of your documentation, and ultimately whether your line stays running or your customer deadlines get missed.
This guide walks you through six decision dimensions that separate sustainable supply partnerships from the ones that create monthly firefighting. By the end, you’ll have a framework to match your specific demand profile—volume stability, spec mix, lead-time sensitivity, and risk tolerance—to the right sourcing model.
Executive Summary: The Fast-Answer Matrix
Before diving into the mechanics, here’s the core pattern we see play out across successful kraft paper supply strategies:
Manufacturers (mills) win when you have:
- Stable, high-volume demand that justifies container-load commitments
- Spec-locked requirements (consistent basis weight, Cobb, burst strength across orders)
- Predictable shipping lanes with minimal variation
- The internal capacity to manage direct mill relationships and longer lead times
Converters win when you need:
- Mixed spec flexibility across multiple product lines or customers
- Smaller minimum order quantities that don’t lock up working capital
- Backup sourcing options when a single mill faces downtime or capacity constraints
- Faster rebooking agility during disruptions or seasonal peaks
The hybrid model makes sense when:
- Your base-load volume is stable enough for mill-direct economics
- But you face periodic spec variations, rush orders, or peak demand that requires agility
- You want a live cost sanity-check mechanism between your primary and backup sources
The matrix below provides a quick reference for matching your operational context to the most appropriate sourcing model:
| Your Situation | Volume Stability | Spec Variance | Lead-Time Flexibility | Best Fit |
| Predictable, high-volume single grade | High | Low | Medium-High | Manufacturer |
| Mixed specs, variable demand | Medium | High | Low | Converter |
| Stable base + seasonal peaks | Medium-High | Medium | Medium | Hybrid |
| New market entry, testing demand | Low | High | Low | Converter |
| Cost-sensitive, long planning cycles | High | Low | High | Manufacturer |
How Manufacturer and Converter Business Models Create Different Outcomes
Understanding the structural differences between these two partner types explains why they excel in different scenarios.
Manufacturers Own the Production Process
Manufacturers own their production lines. This gives them direct control over the papermaking process—from pulp preparation through forming, pressing, and drying. Mills in regions like India and Indonesia have built substantial capacity for virgin kraft grades at scale, optimizing around long production runs that deliver lower unit costs. When a mill commits to your spec, they’re adjusting their own equipment settings, managing their fiber mix, and running their own quality tests using standardized methods like TAPPI T 410 (basis weight), T 411 (thickness), T 403 (bursting strength), or T 441 (water absorption / Cobb test).
This upstream control matters when spec consistency is your top priority. A mill that produces to your tolerance requirements can demonstrate process capability through documented evidence: ISO 9001 scope covering kraft paper production, third-party certification audits for FSC or PEFC chain of custody, and test reports showing variance within your acceptable ranges.
The trade-off is commercial rigidity. Mills optimize around long production runs of standard specifications. Switching between grades, basis weights, or special treatments creates downtime and setup costs. This economic reality manifests as higher minimum order quantities, longer lead times for non-standard specs, and pricing structures that reward volume commitment.
Converters Aggregate Supply and Add Distribution Value
Converters don’t own mills. They source parent reels from one or more manufacturers, then slit, sheet, or rewrap to your finished dimensions. Regional converters in markets like Turkey and Saudi Arabia have built specialized capabilities in quick-turn customization and smaller batch processing. Their quality assurance happens at the sourcing stage—pre-qualifying mills, verifying incoming material against spec, and managing any deviations before your order ships.
The converter’s value lies in breadth: they can access multiple mills’ capacity, blend sources to meet mixed specs, and pivot suppliers if one mill faces downtime or capacity constraints.
MOQs and Working Capital Impact
Mills typically quote in container-load or full-truck quantities. For high-volume buyers, this makes economic sense—you’re capturing mill-direct pricing and avoiding a middleman markup. But it also means your working capital is tied up in larger inventory positions, and your flexibility to adjust order sizes shrinks.
Converters aggregate demand across multiple buyers. This lets them offer smaller minimums because they’re already consolidating shipments. If your demand is variable—seasonal peaks, project-based runs, or spec changes across customer orders—a converter’s flexibility can prevent the cash flow trap of overbuying or the stock-out risk of underbuying.
From a logistics perspective, converters often maintain broader lane coverage because they’re shipping to diverse buyer profiles. A single mill may have optimized freight relationships for their core export lanes but limited options for secondary routes. A converter who regularly ships to your region brings established carrier relationships, better freight rate visibility, and faster rebooking when disruptions hit.
Commercial Models and Price Stability
Mills prefer stable, annualized agreements. Long-term contracts let them plan production runs, lock in fiber costs, and offer more predictable pricing. If your demand forecast is reliable and your specs won’t drift, a mill partnership can deliver better year-over-year cost control.
Converters operate with more transactional flexibility. Pricing may shift with market conditions, but so does their ability to source opportunistically. When pulp prices spike or freight rates surge, a converter with multi-mill access can sometimes navigate around bottlenecks faster than a single mill constrained by its own cost structure.
The trade-off is transparency. With a mill, you’re one step closer to the cost drivers—fiber, energy, freight from origin. With a converter, you’re paying for their sourcing intelligence and agility, but you have less visibility into the margin structure.
Cost-to-Door Comparability Beats Quote Price
Comparing a manufacturer’s FOB quote to a converter’s CIF quote without normalization is worse than useless—it actively misleads your decision. The headline price tells you nothing about what you’ll actually pay once freight, insurance, duties, and handling costs land at your door.
Normalize All Quotes to a Single To-Door Basis
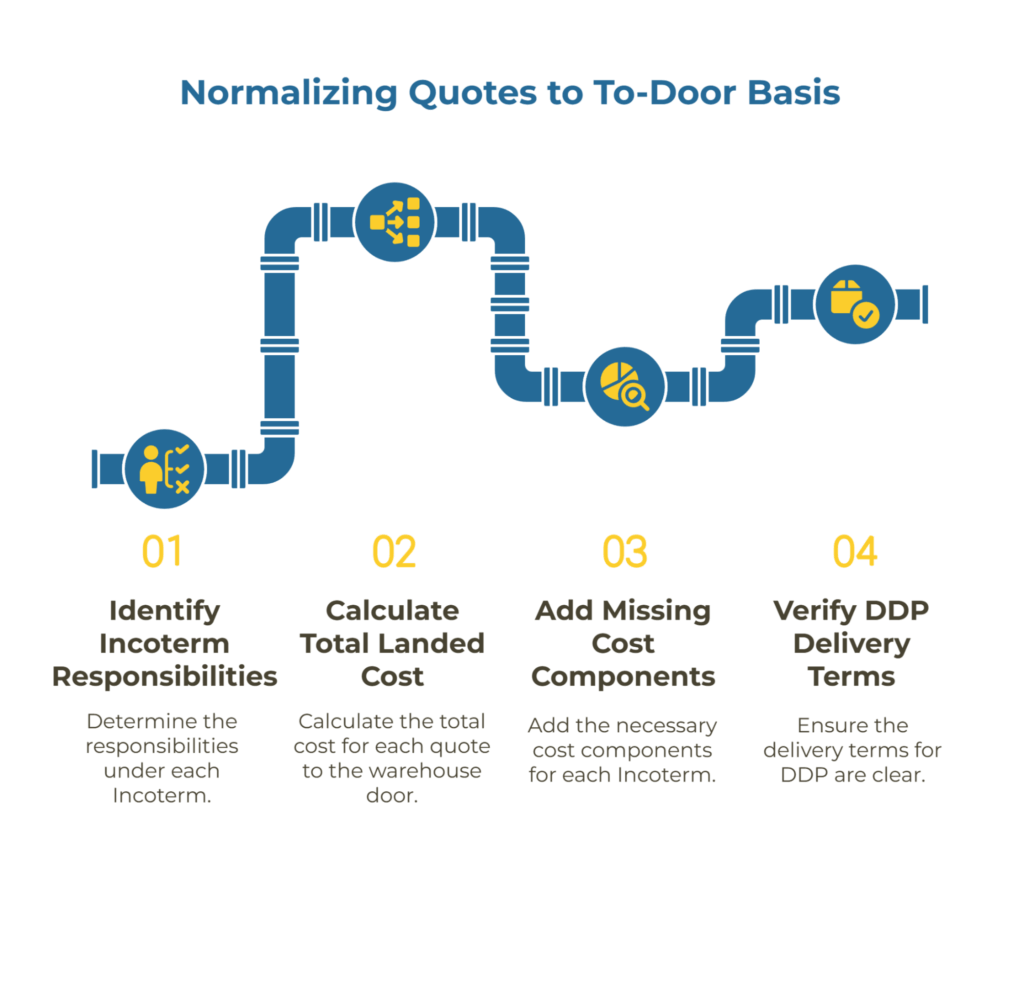
Start by mapping responsibilities under each Incoterm. An EXW (Ex Works) quote from a mill puts all logistics risk and cost on you from the factory gate. A CIF (Cost, Insurance, and Freight) quote from a converter includes ocean freight and basic insurance to your destination port—but you still own import duties, port handling, and inland delivery.
The only way to compare fairly is to calculate the total landed cost for every quote as if it were delivered to your warehouse door. Add the missing cost components for each term:
- EXW: add export packing, inland freight to origin port, ocean freight, insurance, duties, destination handling, and inland delivery
- FOB: add ocean freight, insurance, duties, destination handling, and inland delivery
- CIF: add duties, destination handling, and inland delivery
- DDP: this is already to-door, but verify what “delivery” means (port? warehouse? specific address?)
Document your assumptions—exchange rates, freight rates, duty percentages, handling fees—with date stamps. Markets move. What’s true this week won’t be true next quarter, and disputes arise when buyers and suppliers use different baseline assumptions.
For a detailed walkthrough of this normalization process, see our guide on comparing quotes across Incoterms and the full landed-cost framework for kraft paper.
Stress-Test Freight Scenarios Before Selection
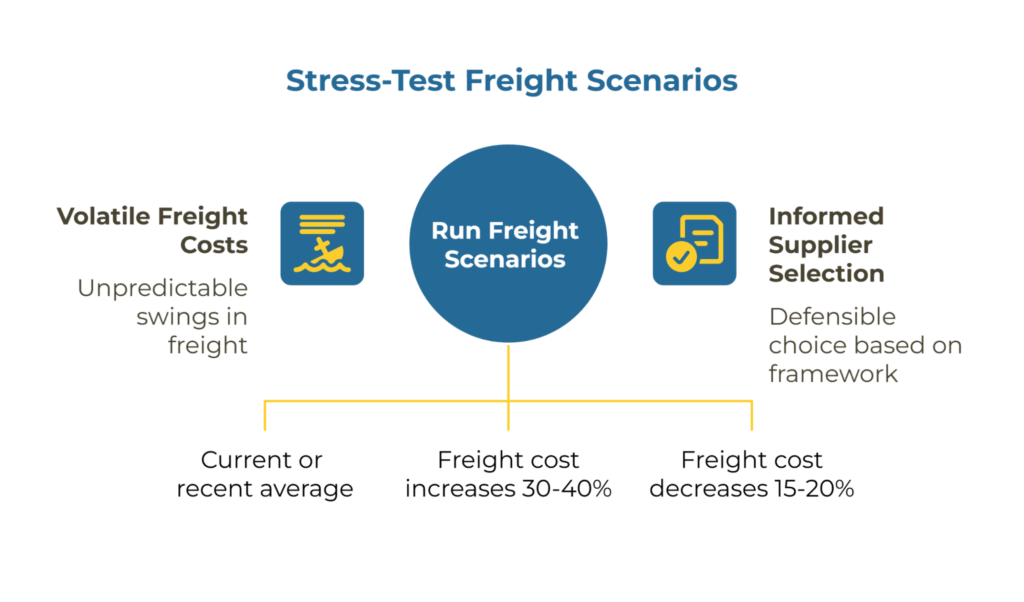
Here’s where most teams stop too early. You’ve normalized quotes to a baseline freight rate—usually a spot rate or a recent average. But freight is volatile. Ocean rates can swing 30-50% in a quarter depending on peak season surcharges (PSS), general rate increases (GRI), or capacity constraints on your lane. Carrier surcharges alone can add 15-25% to baseline costs within weeks.
Run three scenarios for each shortlisted supplier:
- Baseline: current or recent-average freight rate
- Surge: freight cost increases by 30-40% (simulating peak season or tight capacity)
- Relief: freight cost decreases by 15-20% (simulating over-capacity or off-peak conditions)
Calculate the to-door total under each scenario. If Supplier A is cheapest at baseline but becomes 8% more expensive under surge conditions, and Supplier B stays competitive across all three scenarios, you’ve just identified hidden risk. The “cheapest” quote might not be the most defensible choice when your CFO asks why costs spiked during Q4.
This stress-test discipline also forces you to articulate your decision rationale in writing. When the next quarter’s pricing negotiation starts, you’re defending a framework, not an arbitrary choice.
Quality Assurance and Spec-Truth: Preventing Hidden Costs
A quote that looks competitive on price can turn into a loss generator if the delivered product doesn’t match your spec. Tolerance drift, test method misalignment, or certification gaps create claims, rework, and downstream customer complaints—costs that never appear in the original quote comparison.
Normalize Specs Before Comparing Prices
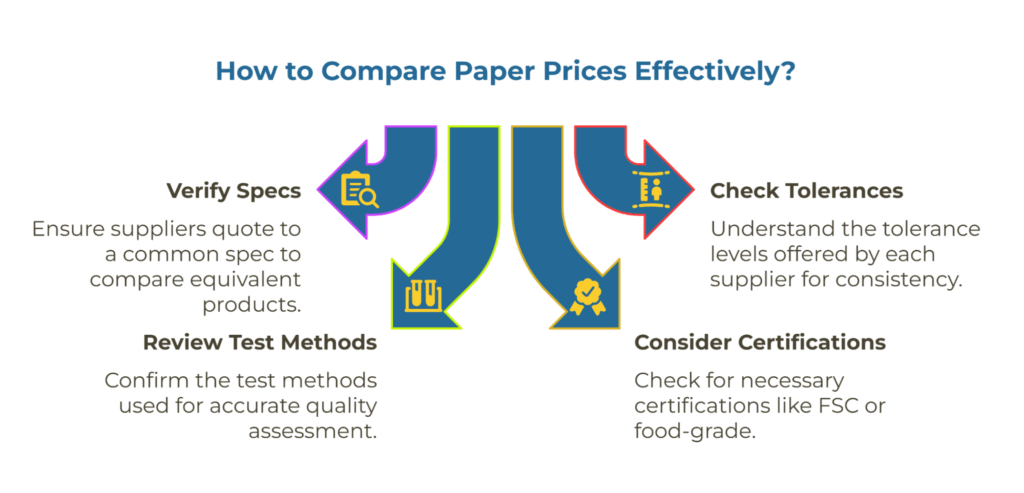
Not all “80 GSM kraft paper” is identical. One supplier’s spec might allow ±3% tolerance on basis weight, while another holds ±2%. One quotes Cobb value (water absorption) using TAPPI T 441, another uses ISO 535. One measures burst strength with a Mullen tester per TAPPI T 403, another uses ISO 2758.
These aren’t interchangeable. A tighter tolerance costs more to produce but delivers more consistent performance in your converting process. A different test method might yield different absolute values even if the underlying paper quality is similar.
Before you compare prices, verify you’re comparing equivalent specs:
- Basis weight (GSM) with stated tolerance
- Moisture content with acceptable range
- Cobb value (g/m² at 60 seconds or 120 seconds)
- Burst strength (kPa via TAPPI T 403 or ISO 2758)
- Tensile strength or tear resistance if relevant to your application
- Any required certifications (FSC, PEFC, food-grade if applicable)
If two suppliers quote different tolerances or test standards, you’re not comparing the same product. Ask both to quote to a common spec—your spec—before making a cost decision.
Our kraft paper manufacturers capability matrix provides a structured template for capturing and normalizing these variables across multiple suppliers.
Verify Factory Evidence and Certification Integrity
Mills should be able to provide documentary evidence of their quality management system. At minimum, look for:
- ISO 9001 certification with scope explicitly covering kraft paper production (not just general manufacturing)
- Test method alignment: confirmation that their lab uses the same TAPPI or ISO methods you specified
- Certification registry verification: if FSC or PEFC certification is required, cross-check the certificate number against the official registry to ensure it’s current and covers the product category you’re buying
Converters should demonstrate how they pre-qualify and monitor their mill sources. Ask for:
- A list of mills they source from for your product category
- Evidence that those mills hold relevant certifications
- Their incoming inspection process and what triggers a batch rejection
Process capability matters more than promises. A mill with documented process performance indices (Ppk ≥ 1.33 for critical characteristics like basis weight and burst strength) is statistically more likely to deliver consistent quality than one that simply claims “we meet your spec.”
For a complete evaluation framework, see our factory audit checklist for kraft paper manufacturers.
The Hidden Cost Impact of Tolerance and Test Method Differences
Tolerance drift doesn’t just create quality complaints—it drives real cost. If your spec calls for 80 GSM ±2% and your supplier delivers at 77.5 GSM (within their internal ±3% tolerance but below your floor), you’re getting 3% less material by weight. Scale that across annual volume and it becomes measurable revenue leakage.
Similarly, if your downstream customer measures Cobb using ISO 535 but your supplier certifies using TAPPI T 441, the absolute values may differ even if the paper performs identically. This creates disputes, delays invoice approval, and risks customer returns—all friction costs that weren’t in the original quote comparison.
Spec-truth is a leading indicator of total cost. Get this alignment right during vendor selection, not during your first claims negotiation.
Reliability and Risk: What Actually Predicts On-Time, In-Full Delivery
Price and spec matter, but they’re irrelevant if the shipment doesn’t arrive when promised or arrives incomplete. On-time, in-full (OTIF) performance—or its export equivalent, on-time delivery (OTD)—is the reliability metric that determines whether your downstream operations stay smooth or turn into crisis management.
Booking Lead Times and Rollover History
Ask every shortlisted supplier for two data points:
- Typical booking lead time from PO receipt to vessel departure (for ocean shipments) or truck dispatch (for inland)
- Rollover rate over the past 12 months: what percentage of confirmed bookings missed the original vessel or delivery date and had to be rescheduled?
A mill quoting a 15-day lead time with a 5% rollover rate is more reliable than a converter quoting 10 days with a 20% rollover rate. The extra five days of planning horizon is a small price for predictability.
Track both quoted and actual lead times across your order history. Calculate the standard deviation—suppliers with standard deviations under 5 days demonstrate strong production planning and logistics coordination. Those with 5-10 day variance show acceptable performance. Suppliers exceeding 10 days are signaling systemic issues with capacity management, mill prioritization, or freight coordination.
Rollover history reveals capacity management discipline. A rollover rate of 1-3% indicates healthy operations with appropriate contingency planning. Rates of 5-10% suggest underlying operational issues—the supplier overcommits capacity, fails to maintain adequate inventory, or prioritizes other customers over your orders.
Rollover risk escalates when a single mill faces capacity constraints, maintenance shutdowns, or upstream fiber supply issues. This is where converters demonstrate their structural advantage: they can pivot to an alternate mill within their network, keeping your delivery on track even when one source falters.
Our supplier reliability scorecard provides a 0-5 scoring framework for these variables, making it easy to compare multiple suppliers objectively.
Documentation Accuracy as a Leading Indicator
Here’s a pattern that holds across industries: suppliers who consistently submit error-free export documentation also tend to deliver on time and in spec. Documentation accuracy isn’t just a paperwork issue—it’s a proxy for operational discipline.
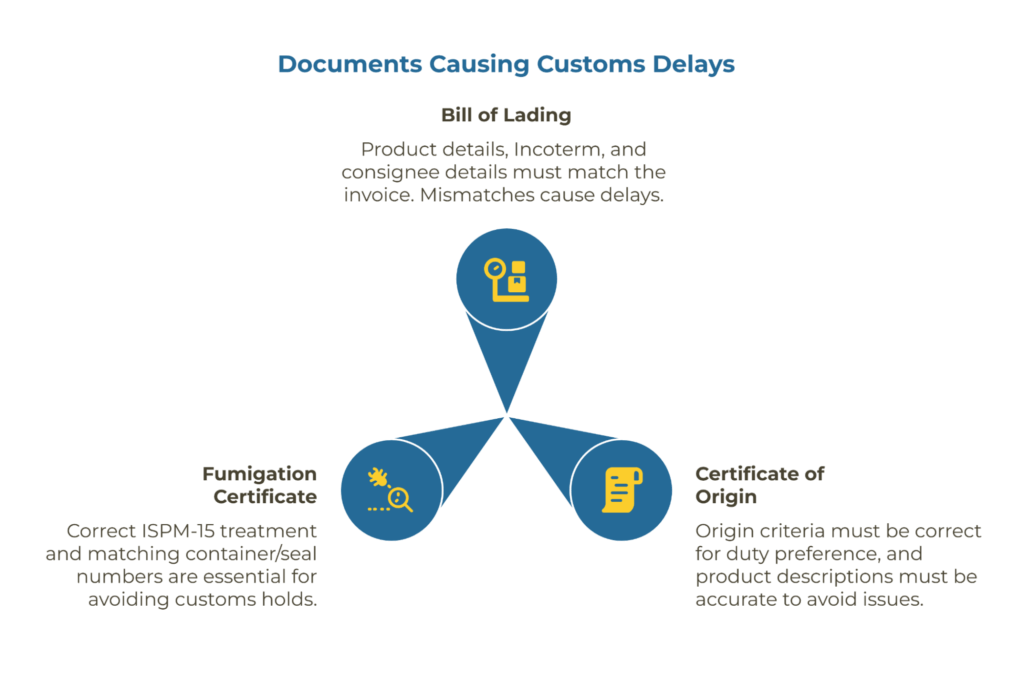
The three documents that cause the most customs delays and demurrage charges are:
- Bill of Lading (BL): product description, Incoterm, container/seal numbers, and consignee details must match the commercial invoice exactly
- Certificate of Origin (COO): must reflect the correct origin criteria for duty preference and can’t contain typos in the product description
- Fumigation Certificate (if required): must reference the correct ISPM-15 treatment and show matching container/seal numbers to the BL
When these documents contain mismatches—wrong Incoterm, missing seal numbers, inconsistent product descriptions—your shipment sits at the port accumulating demurrage while you scramble for corrections. Worse, some errors trigger customs holds that delay clearance by days or weeks.
A supplier’s historical documentation accuracy rate is predictive. If they consistently submit clean paperwork on the first pass, it signals strong internal QA and coordination between sales, logistics, and documentation teams. If you’re seeing frequent corrections or mismatches, that operational risk will eventually show up in missed delivery windows.
For a field-by-field validation checklist, see our guide on export documentation for kraft paper.
When Mill-Direct Wins on Predictability
Despite converters’ agility advantage, mills offer one structural benefit: line-of-sight control. When you’re buying directly from the manufacturing source, there’s one less coordination layer. You’re working directly with the production scheduler, the quality manager, and the export logistics team. Communication is faster, escalation paths are clearer, and you have visibility into production status without filtering through an intermediary.
For buyers with stable, high-volume demand and the internal resources to manage direct mill relationships, this transparency often outweighs the flexibility converters provide. The trade-off is that when a mill faces downtime—equipment failure, labor issues, raw material shortages—you absorb the full impact unless you’ve built backup capacity into your strategy.
This is why the hybrid model exists. You maintain a primary mill relationship for base-load volume and predictability, but keep a qualified converter as a backup source for peaks, spec variations, or mill disruptions. Our integration playbook shows how to structure this dual-source strategy without duplicating qualification effort.
Logistics and Incoterms: Where the Risk Actually Shifts
Choosing between a manufacturer and a converter isn’t just about who makes the paper—it’s about who controls the freight, who bears the risk during transit, and whose insurance covers damage or loss. These responsibilities are defined by the Incoterm you select, and different partner types handle them with different levels of competence and control. The International Chamber of Commerce establishes and maintains these standardized trade terms, providing the authoritative framework for allocating transport, insurance, and customs responsibilities in international transactions.
Why CIP Often Beats CIF for Containerized Kraft Paper
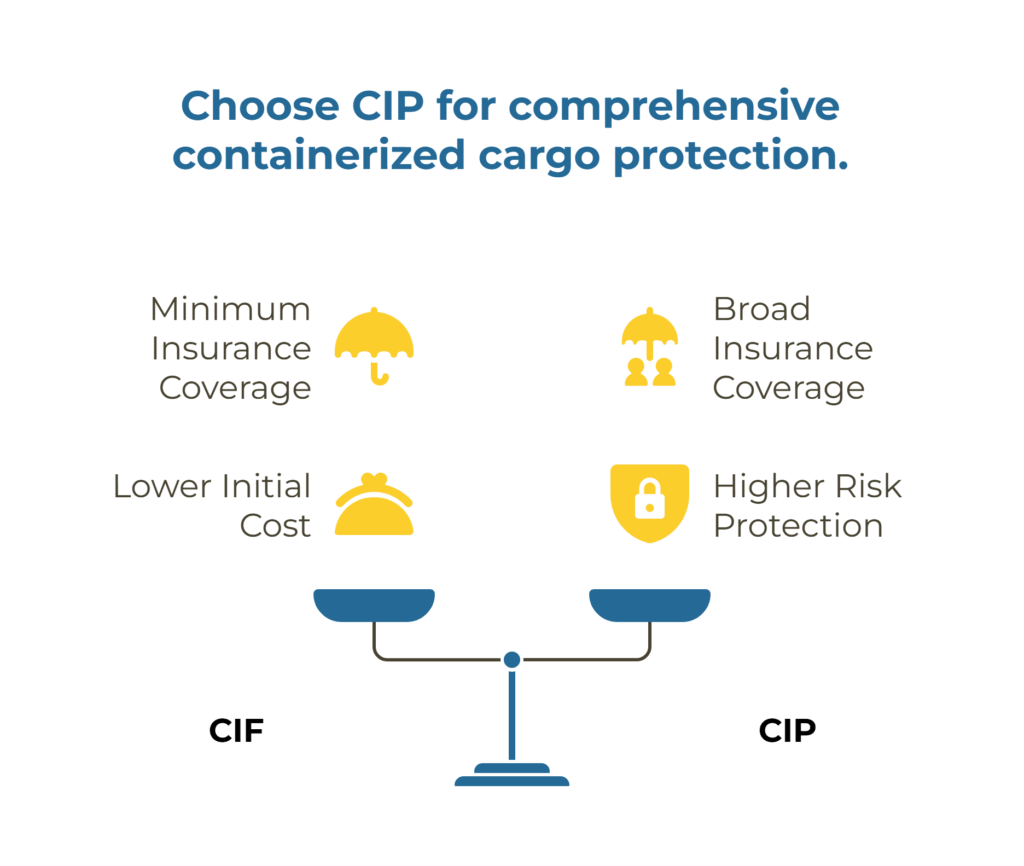
Most kraft paper moves in containers, not bulk break cargo. Yet many buyers still default to CIF (Cost, Insurance, and Freight) because it’s familiar. Here’s the issue: CIF was designed for bulk and break-bulk shipments and only requires “minimum cover” insurance under Institute Cargo Clauses (C)—the most restrictive coverage tier.
Institute Cargo Clauses (C) excludes many handling risks that commonly affect containerized cargo: damage from improper stowage, container moisture condensation, or rough handling during transshipment. If your kraft paper arrives with water damage from condensation or edge crush from poor container packing, a CIF policy under ICC (C) may not cover it.
CIP (Carriage and Insurance Paid To) is the modern, container-friendly equivalent. Under Incoterms® 2020, CIP requires Institute Cargo Clauses (A)—the broadest coverage tier—which includes risks that ICC (C) excludes. The additional insurance cost is typically only 0.1-0.3% of cargo value, but it eliminates the coverage gaps that leave kraft paper vulnerable during the complex journey from mill to your facility.
The structural difference between manufacturers and converters shows up here. A mill shipping direct may have less experience optimizing container loading, dunnage, and moisture protection compared to a converter who specializes in export logistics. If you’re buying mill-direct on EXW or FOB terms, you’re assuming that loading and stowage risk—make sure your freight forwarder has kraft paper experience, or negotiate FCA (Free Carrier) with the mill handling container loading under your forwarder’s supervision.
For detailed guidance on choosing Incoterms that shift risk appropriately, see our articles for incoterms for kraft paper exporters and incoterms for kraft paper buyers.
Lane-Aware Selection and Freight Control
Some lanes are straightforward: high-volume routes with frequent sailings, multiple carrier options, and stable freight rates. Other lanes—secondary ports, inland destinations, or routes with limited direct service—require more logistics sophistication.
Mills optimized for one or two primary export lanes may lack flexibility when you need shipments to secondary destinations. They’ve negotiated freight rates with carriers for their core routes, but when you request delivery to an inland warehouse two hours from the port, they’re quoting on-the-fly or adding a margin for uncertainty.
Converters who ship to diverse buyer profiles across multiple regions tend to have broader lane coverage and carrier relationships. If your supply chain includes multiple destination points or you need to shift delivery locations as your operations expand, a converter’s established logistics network can save you the effort of qualifying new freight routes with each mill.
The flip side: if you’re a high-volume buyer shipping to a single, stable destination, the mill’s lane specialization can work in your favor. They’ve optimized that specific route, their freight rates are locked, and you’re not paying for flexibility you don’t need.
Documentation Accuracy: Why Perfect Paperwork Matters More Than You Think
A $50,000 kraft paper shipment held at customs for missing or incorrect documentation can cost thousands in demurrage, rush fees for corrected documents, and production stoppages. Documentation errors that seem minor in principle—a typo in the Bill of Lading, an HS code missing one digit, a Certificate of Origin signed by someone lacking proper authority—create major consequences in practice.
The Critical Documents and Common Failure Points
The Bill of Lading (BL) serves as the primary transport contract and proof of cargo ownership. Discrepancies between the BL description and the commercial invoice trigger customs scrutiny. Common errors include mismatched container numbers, incorrect gross weights, omitted “notify party” details required by the destination country, or wrong cargo descriptions that fail to match the HS classification system.
Certificate of Origin (COO) establishes the goods’ origin country for tariff determination under trade agreements. Many preferential trade agreements require origin certificates on specific forms signed by authorized bodies. Using the wrong form, missing signature authority verification, or claiming origin that doesn’t meet the agreement’s rules of origin criteria all result in rejected certificates and loss of preferential duty rates.
Fumigation certificates prove that wood packaging materials (pallets, crating) meet ISPM-15 international standards to prevent pest transmission. Certificates must reference the specific container numbers, treatment method (heat treatment or methyl bromide), and certification body. Generic certificates covering multiple shipments or lacking proper container identification get rejected by plant health authorities.
Product quality certificates, mill test reports, and FSC/PEFC Chain of Custody documents complete the documentation package. Each requires internal consistency—the batch numbers, specifications, and quantities must align across all documents. Inconsistencies signal potential fraud or documentation errors that customs officials won’t overlook.
Manufacturer vs Converter Documentation Strengths
Manufacturers handling their own exports develop documentation muscle memory for their standard products and typical destination countries. Their advantage is consistency—the same person or team produces similar documentation packages repeatedly, reducing novelty-driven errors. Their weakness is destination-country expertise; a mill that mainly serves European markets may struggle with the specific requirements of Middle Eastern or African customs regimes.
Converters managing high shipment volumes across diverse destinations often employ dedicated documentation teams with specialists for different regions. Their advantage is breadth of expertise and systematic process. Their weakness is coordination complexity; they must obtain and integrate mill-origin documentation with their own commercial documents, creating opportunities for discrepancies between the mill’s test reports and the converter’s commercial invoices.
Neither model inherently produces better documentation accuracy—it depends on the operational discipline of specific suppliers. Audit documentation accuracy systematically by requesting copies of recent commercial invoices, Bills of Lading, and certificates for representative shipments. Review for internal consistency, completeness of required fields, and whether any customs rejections or amendments occurred.
Strong suppliers maintain documentation checklists specific to each destination country, conduct internal pre-shipment document reviews before releasing to freight forwarders, and track error rates as a formal KPI. Weak suppliers treat documentation as an administrative afterthought, reacting to customs problems rather than preventing them through systematic procedures.
Pre-Shipment Validation Reduces Clearance Delays
Implementing a pre-shipment validation step—where you or your customs broker reviews scanned documents before the goods arrive—catches errors while they’re still correctable without urgency. A missing signature can be obtained, an incorrect HS code can be revised, or a mismatched container number can be fixed. Once goods arrive at the destination port without proper documentation, fixing errors becomes an expensive rush job with demurrage charges accumulating daily.
Require suppliers to provide scanned document packages 3-5 days before estimated vessel arrival. Build a simple checklist covering the critical elements: BL matches commercial invoice, HS codes are complete and correct, all required certificates are present and valid, quantities and container numbers align across documents, and signatures from authorized parties are visible. This 15-minute review per shipment prevents 80% of customs-clearance delays.
For comprehensive guidance on evaluating documentation processes and building pre-shipment validation protocols, see the export documentation checklist.
Decision Framework: Scoring Your Options and Choosing the Right Model
You now have the evaluation criteria; the next step is applying them systematically to your specific situation. This framework breaks the decision into three phases: profiling your demand characteristics, scoring potential suppliers against those characteristics, and determining whether a manufacturer, converter, or hybrid approach best fits your profile.
Phase 1: Profile Your Demand Characteristics
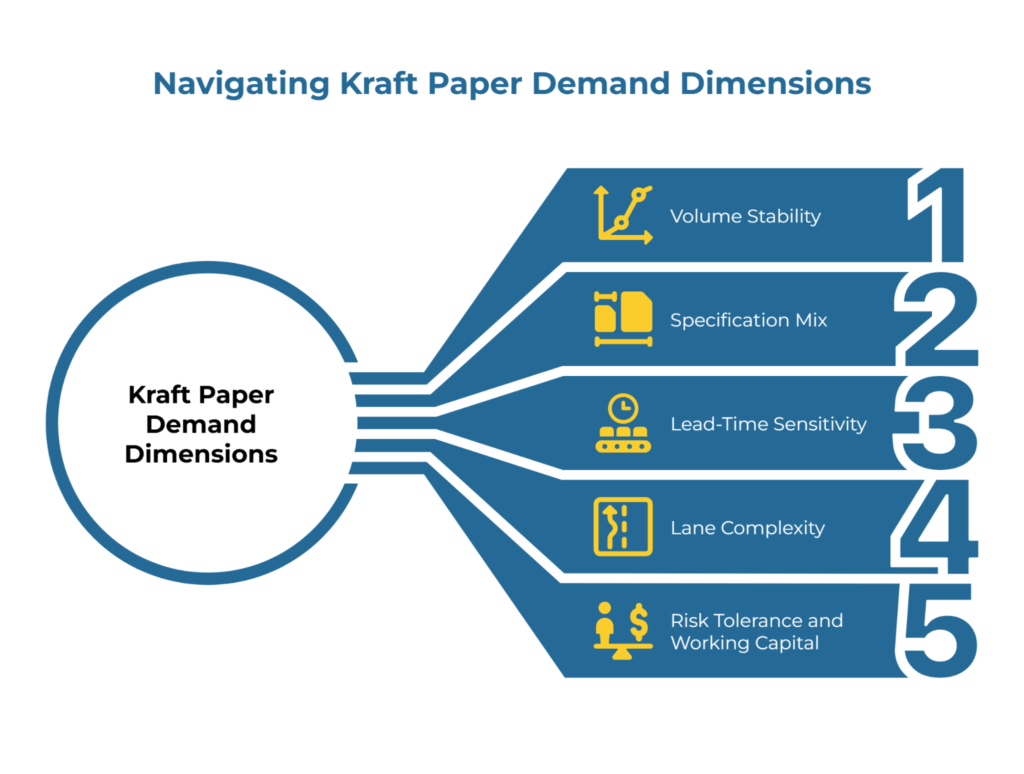
Start by honestly assessing five dimensions of your kraft paper demand:
Volume Stability: Calculate your coefficient of variation (CV) for monthly purchase volumes over the past 12-24 months. The formula is simple: divide your standard deviation by your mean monthly volume. A CV below 20% suggests stable demand that favors mill relationships; above 40% indicates variable demand where converter agility adds value.
Specification Mix: Count how many distinct kraft paper specifications (basis weight, finish, width, certification requirements) you purchase. Single-specification buyers align well with mill production economics; buyers needing 5+ specifications benefit from converter breadth.
Lead-Time Sensitivity: Determine your typical order-to-delivery window. If you can consistently provide 60+ day lead times, mill production scheduling poses no problem. If you need reliable 30-day or rush 14-day deliveries, converter inventory and established logistics become critical.
Lane Complexity: Map your destination requirements. Single-lane buyers (one origin to one destination) can build deep expertise and relationships with a mill and freight forwarder. Multi-lane buyers (multiple origins, multiple destinations) may benefit from a converter’s established networks.
Risk Tolerance and Working Capital: Assess your ability to manage supply disruption and inventory carrying costs. Buyers with strategic inventory, alternative internal processes, or customer relationships that tolerate occasional delays can accept single-mill risk and the working capital tied up in larger mill MOQs. Those with just-in-time operations, rigid customer commitments, or limited buffer inventory need multi-source resilience and the staged deliveries that converters enable—accepting higher per-unit costs in exchange for reduced inventory carrying costs.
Phase 2: Score Suppliers Across Critical Dimensions
Build a supplier scorecard evaluating each potential partner—whether manufacturer or converter—on the factors that predict actual performance. Use a 0-5 scale for each dimension, with clear definitions for each score level:
Cost-to-Door Competitiveness (0-5):
- 5: Lowest normalized to-door cost across all freight scenarios
- 3: Competitive but not lowest; within 5% of best option
- 1: 10%+ premium versus alternatives with no offsetting advantages
- 0: Pricing completely uncompetitive or supplier unable to provide freight quotes for normalization
Quality Assurance Evidence (0-5):
- 5: ISO 9001 manufacturing scope, Cpk ≥1.33, process control charts, current FSC/PEFC registry confirmation
- 3: ISO 9001 certified with valid test reports but no process capability data
- 1: Quality certificates claimed but unverified or expired
- 0: No credible quality evidence or certificate verification refusals
Reliability Track Record (0-5):
- 5: ≤5-day lead time standard deviation, ≤2% rollover rate, 95%+ documentation accuracy
- 3: 5-10 day lead time variance, 2-5% rollover rate, 90-95% documentation accuracy
- 1: >10 day lead time variance, >5% rollover rate, 85-90% documentation accuracy
- 0: No historical data available or supplier refuses performance metrics
Logistics Capability (0-5):
- 5: Lane-specific expertise with your required routes, established carrier relationships, track record of problem resolution
- 3: General competence but limited experience with your specific lanes
- 1: Minimal logistics capabilities or frequent execution issues
- 0: Significant logistics failures or inability to serve required lanes
Sum the scores. Suppliers scoring 16-20 are strong candidates regardless of business model. Those scoring 8-12 may work for secondary volumes or trial programs but pose risk as primary partners. Below 8 signals fundamental capability gaps that won’t improve without significant operational changes unlikely to occur.
Phase 3: Match Business Model to Your Profile
With demand characteristics profiled and suppliers scored, the decision framework becomes clear:
Choose Manufacturer-Direct When:
- Your demand profile shows high stability (CV <20%), single or narrow spec range, and lead-time flexibility
- The highest-scoring supplier is a manufacturer
- You value upstream process visibility and long-term price predictability
- Your organization can manage direct mill relationships and arrange freight confidently
- Working capital allocation favors locking in larger volumes for unit cost advantages
Choose Converter When:
- Your demand profile shows variability (CV >40%), multiple specs, or tight lead times
- The highest-scoring supplier is a converter
- You value MOQ flexibility, backup lanes, and need operational agility
- You prefer delegating logistics coordination and documentation to specialists
- Working capital constraints favor smaller, more frequent deliveries despite higher per-unit costs
Choose Hybrid When:
- You have bimodal demand—stable base-load requirements plus variable peak or special-specification needs
- Multiple suppliers score competitively (16+ points) across both categories
- You want competitive tension for cost sanity-checks between direct and indirect options
- Your organization can manage separate processes for base-load and flex-volume relationships
The hybrid model typically means awarding 60-70% of volume to a mill under term contracts for your stable, core requirements, with 30-40% allocated to a converter for peak periods, special specifications, or backup continuity. This provides cost advantages from mill volume commitments while maintaining operational flexibility through converter relationships.
Quarterly Re-Scoring and Continuous Improvement
Supplier performance drifts over time. Set calendar reminders for quarterly re-scoring using the same framework. Track cost-to-door competitiveness as freight markets shift, update quality evidence with recent test reports and audit results, refresh reliability metrics with lead time and documentation accuracy data from the past 90 days, and assess whether logistics capabilities improved or deteriorated.
Suppliers scoring below 12 for two consecutive quarters should trigger formal corrective action discussions or sourcing diversification. Suppliers consistently scoring 16+ deserve long-term commitment and volume growth. This systematic approach removes emotion and politics from sourcing decisions, replacing them with evidence-based evaluation you can defend to finance, operations, and executive stakeholders.
Frequently Asked Questions
Should I always choose the manufacturer with the lowest EXW price?
No. EXW pricing excludes freight, insurance, duties, and logistics costs that you’ll bear. A manufacturer with a slightly higher FOB price might deliver lower total to-door costs if they have better freight rates or if their location offers shorter transit times. Always normalize quotes to a single to-door basis before comparing, and stress-test the comparison under different freight scenarios to identify which supplier remains cost-competitive across market conditions.
How do I verify a supplier’s quality certificates are legitimate?
For ISO 9001 certification, request the full certificate (not just a logo) and verify it through the issuing certification body’s online registry using the certificate number. Check that the scope explicitly covers kraft paper manufacturing or trading, confirm the certificate is currently valid (not expired or suspended), and verify the address on the certificate matches the supplier’s actual facility. For FSC or PEFC chain-of-custody certificates, use the certification body’s online database to independently confirm validity and scope.
What’s the biggest risk in working with converters versus mills?
The primary risk with converters is distance from the production process. When quality issues arise, resolution requires coordination between you, the converter, and the source mill—adding time and complexity. Additionally, a converter’s financial stability and prioritization of your orders relative to other customers becomes relevant to your supply continuity. Mitigate this by verifying that converters maintain inventory buffers, have relationships with multiple mills for backup lanes, and provide transparent mill-source documentation.
Can I source from both a manufacturer and a converter simultaneously?
Yes, and this hybrid approach often delivers optimal results for buyers with bimodal demand patterns. Allocate 60-70% of your stable, high-volume requirements to a mill under term contracts to secure cost advantages and price predictability. Route the remaining 30-40%—peak demand, special specifications, or backup continuity needs—through a converter to maintain operational flexibility. This dual-source strategy provides competitive tension for cost benchmarking while reducing single-supplier risk.
How often should I re-evaluate my manufacturer versus converter decision?
Conduct formal re-evaluation quarterly using the same scoring framework. Track cost-to-door competitiveness as freight markets and prices shift, refresh reliability metrics with recent lead time and documentation accuracy data, verify quality certificates remain current, and assess whether your demand profile characteristics have changed. Market conditions, supplier performance, and your own requirements all evolve—systematic re-evaluation ensures your sourcing strategy stays aligned.
What if my volumes are too small for direct mill relationships?
Small-volume buyers often find converters more practical because converters aggregate demand across multiple customers, enabling access to mill production without meeting minimum order quantities directly. As a general threshold, direct mill relationships typically become economical around consistent monthly volumes of 50-100 tons for standard grades. Below that threshold, focus your evaluation on converter reliability, documentation accuracy, and whether they maintain adequate inventory to serve your lead-time requirements. As your volumes grow over 12-18 months, revisit the manufacturer-direct option.
What to Do Next
This framework gives you a repeatable, defensible process for choosing between manufacturers and converters. But frameworks only create value when you apply them to real supplier options.
If You’re a Buyer
Publish a spec-true RFQ that invites both manufacturers and converters to quote. Use the normalization process in this guide to calculate cost-to-door for every response. Score reliability and documentation accuracy using the evidence-first criteria outlined above. Shortlist based on composite scores, not headline price.
If you’re ready to start that process, submit your RFQ on PaperIndex and receive quotes from both mills and converters across our global network. You can also browse verified suppliers in our kraft paper suppliers directory or kraft paper manufacturers (mills) directory.
If You’re a Supplier
Build your company profile to directly address the decision criteria buyers use. Publish evidence—not promises—for the factors that matter:
- Quality assurance scope: ISO certifications, test method alignment (TAPPI/ISO), and certification registry numbers buyers can verify
- Reliability data: typical booking lead times, historical OTIF rates, and lane coverage with freight partners
- Documentation process: how you ensure BL, COO, and certificate accuracy before submission
- Spec flexibility or volume capacity, depending on whether you’re positioning as a converter or manufacturer
If you’re ready to connect with qualified buyers who use frameworks like this one, list your company free on PaperIndex and build a profile that answers the questions procurement teams actually ask.
For more resources on international kraft paper sourcing, supply chain risk management, and documentation best practices, visit the PaperIndex Academy.
Disclaimer: This article is educational. PaperIndex is a neutral, non-transactional marketplace and does not sell market intelligence or publish pricing indices. All negotiations and pricing are conducted directly between buyers and suppliers.
How We Cite Our Sources
To maintain editorial credibility and help readers verify the information presented, we cite authoritative external sources where relevant. References are provided as numbered footnotes linking to official standards bodies, government agencies, and recognized industry organizations. For any figures or benchmarks, we use publicly available information from these trusted sources or clearly label illustrative examples as hypothetical.
Our Editorial Process
Our expert team uses AI tools to help organize and structure our initial drafts. Every piece is then extensively rewritten, fact-checked, and enriched with first-hand insights and experiences by expert humans on our Insights Team to ensure accuracy and clarity.
About the PaperIndex Insights Team
The PaperIndex Insights Team is our dedicated engine for synthesizing complex topics into clear, helpful guides. While our content is thoroughly reviewed for clarity and accuracy, it is for informational purposes and should not replace professional advice.