
📌 Key Takeaways
Unit-price savings on corrugated boxes disappear when hidden failure costs—damage, downtime, rework, expediting—scatter across operations, customer service, and finance budgets procurement never sees.
- Failure Events Drive Real Cost: A 0.12% increase in damage rates can eliminate a 6% unit-price advantage, making cheap boxes expensive at scale.
- TCO Models Quantify Risk: Calculate expected annual failure cost using cost per event × event rate × annual volume to compare suppliers on total impact, not invoice price.
- Spec Ambiguity Enables Drift: Vague RFQs let suppliers interpret requirements differently, creating incomparable quotes and dispute leverage gaps after award.
- Five Controls Prevent Spikes: Precise specifications, quote-time evidence packs, acceptance-gated pilots, drift scorecards, and cross-functional decision memos stop hidden costs before contracts lock.
- Prevention Costs Beat Failure Costs: Investing in supplier verification and specification clarity at award eliminates years of absorbing damage, rework, and firefighting downstream.
Decision-grade clarity beats accounting-grade precision when tiny exception-rate changes overwhelm unit-price differences.
Procurement managers sourcing corrugated packaging will gain a defensible framework for justifying quality-focused awards, preparing them for the implementation tools that follow.
Two quotes on your desk. Supplier B is 11% cheaper per unit.
On the fulfillment floor, a supervisor photographs another pallet of crushed cartons—the third this week. The returns queue is backing up. And somewhere in a shared drive, a claims folder grows thicker by the day.
The unit price looked like a win. The total cost tells a different story.
This is the false economy of low-bid corrugated packaging. Unit price is visible, certain, and easy to compare. The costs it triggers—downtime, damage, rework, expediting—scatter across budgets that procurement rarely sees. A sourcing decision that looks defensible on a spreadsheet can fail in operation.
The fix isn’t to ignore price. It’s to measure what price alone misses. Total cost of ownership exists to answer a practical question: what does this purchase actually cost once all the downstream consequences show up? The answer includes direct costs visible on invoices and indirect costs that surface later—downtime, rework, returns.
This guide provides a practical framework for quantifying hidden packaging costs and pre-award controls to prevent them. The result: a methodology to justify paying more per unit when failure costs make cheap boxes expensive.
The False Economy: Why Unit Price Is the Easiest Number—and the Wrong One
Unit price has one compelling advantage: certainty. When comparing supplier quotes, the per-box cost is concrete, auditable, and tied directly to a budget line item.
Failure-event costs are different. They’re probabilistic. They don’t appear on the quote. And they rarely land in procurement’s budget.
This asymmetry creates a structural blind spot. Consider where costs actually accumulate when corrugated packaging underperforms:
- Operations absorbs line stoppages, slower pack-out rates, and emergency changeovers
- Customer service handles complaints, replacements, and concession credits
- Warehouse teams repack damaged orders, add dunnage, and process returns
- Finance reconciles chargebacks and writes off unsalvageable inventory
Each cost is real, recurring, and measurable—but none appears on the packaging invoice.
The problem isn’t carelessness. It’s fragmented cost signals. A 12% unit-price reduction is visible to everyone in the award meeting. A 0.8% increase in damage-related returns is visible only to the fulfillment manager who pulls the exception report.
This pattern follows a familiar quality-management principle: pay prevention costs up front, or pay failure costs forever. Invest in specification clarity and supplier verification at award, or absorb damage, rework, and firefighting for years. Quality experts call this the cost-of-quality framework—and it applies directly to packaging sourcing.
What makes this worse: TCO spikes from packaging failures aren’t random. They follow repeatable mechanisms—boards losing stacking strength in humid conditions, flaps separating under tape stress, flutes crushing under predictable pallet loads. These aren’t one-off bad luck. They’re failure modes with identifiable causes and measurable frequencies.
Once you know where to look, hidden costs become visible. And comparable. The Institute for Supply Management has documented how understanding total cost of ownership transforms procurement decision-making from price-focused to value-focused.
The 4 Hidden Cost Buckets That Usually Dwarf a Unit-Price Win
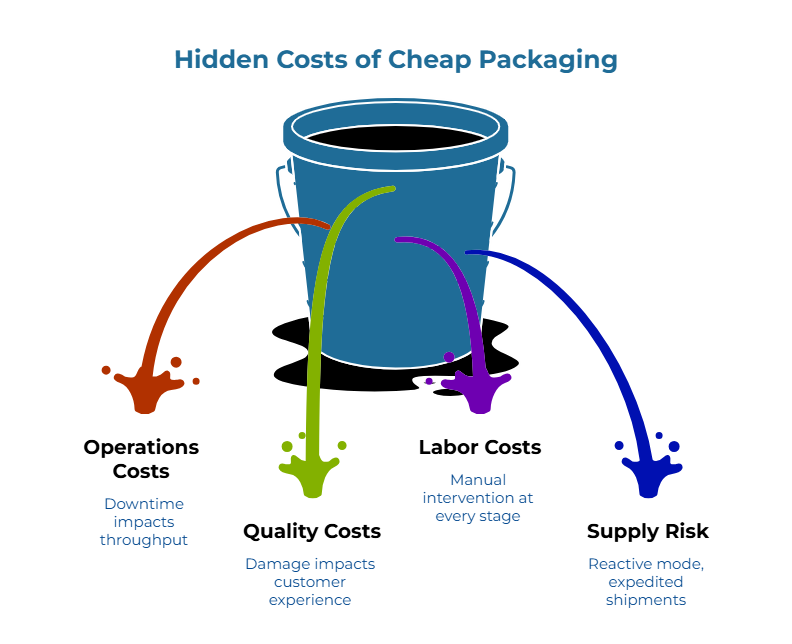
Before modelling failure costs, establish a clean taxonomy. These four categories capture the bulk of hidden costs that make cheap boxes expensive over time.
Operations Costs
Direct impacts on throughput and fulfillment capacity. Line stoppages from jams or misfeeds caused by inconsistent box dimensions. Slower pack-out rates when workers struggle with weak or poorly scored cartons. Emergency changeovers when a batch fails mid-run.
In high-volume environments, even a few minutes of downtime per shift compounds into significant labor and capacity loss. Analysis from supply chain bodies, such as the Association for Supply Chain Management (ASCM) and the Institute for Supply Management (ISM), indicates that unplanned downtime frequently represents a primary source of budget leakage in high-volume distribution centers.
Quality and Customer Experience Costs
Damage in transit is the most visible symptom, but only the beginning. When corrugated packaging fails to protect contents, downstream costs include returned orders, replacement shipments (often expedited), concession credits to retain customers, and—over time—churn risk from buyers who lose confidence.
For e-commerce operations, where the box is the first physical brand impression, these costs carry strategic weight beyond the invoice.
Labor and Rework Costs
Weak or inconsistent packaging creates manual intervention at every stage. Warehouse teams repack orders arriving in damaged boxes. QA inspectors pull samples more frequently when variation runs high. Claims administrators document damage for supplier disputes. Fulfillment workers add extra dunnage or tape to compensate for boxes that don’t hold shape.
Returns don’t simply reverse the outbound journey. Each item triggers inspection, disposition decisions, restocking labor, and coordination overhead—the full reverse-logistics cost structure that rarely appears in packaging ROI discussions.
None of this labor is planned. All of it is paid.
Supply Risk and Firefighting Costs
When supplier quality proves unreliable, procurement enters reactive mode. Expedited shipments fill gaps when batches are rejected. Dual production runs hedge against uncertainty. Sourcing managers spend hours managing exceptions instead of strategy.
When relationships break down, switching costs—new qualification, trial runs, contract negotiation—reset the cycle. These costs are episodic but can dwarf years of unit-price savings in a single quarter. For more on managing supplier concentration, see the hidden cost of single-sourcing.
The insight here is structural: the biggest cost spikes usually land outside procurement’s visibility. A small unit-price win can be overwhelmed by one or two recurring failure-event categories hitting operations, customer service, or finance instead.
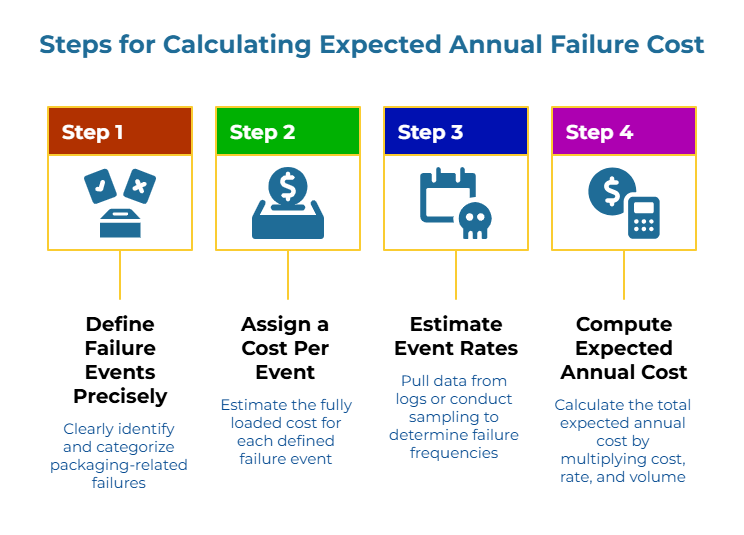
A Simple Failure-Event TCO Model (With a Copy/Paste Worksheet)
The goal isn’t accounting-grade precision—it’s decision-grade clarity. Can a unit-price difference survive even modest increases in failure rates? The model reveals the answer.
This framework translates abstract “total cost of ownership” into a repeatable calculation. Define failure events precisely, estimate what each costs, estimate frequency, and compute expected annual cost. The result: a number comparable across suppliers and defensible in a decision memo.
Step 1: Define Failure Events Precisely
A failure event is any packaging-related occurrence triggering downstream cost. Precision matters. “Damaged box” is too vague—it could mean a scuffed corner (cosmetic, low cost) or a collapsed carton destroying contents (functional, high cost).
Define events by operational consequence:
- Carton crush requiring full repack and replacement shipment
- Flap separation requiring manual tape reinforcement before pack-out
- Dimensional variance causing automated line jam and manual intervention
- Transit damage resulting in customer return and concession credit
Step 2: Assign a Cost Per Event
For each failure event, estimate the fully loaded cost. Include direct costs (labor time, replacement product, freight) and indirect costs (customer service time, claims processing).
Illustrative cost-per-event ranges (adapt to your operation):
- Full repack and replacement: $24–$55 per event
- Manual tape reinforcement: $0.40–$1.20 per event
- Line jam and reset: $25–$80 per event
- Return and concession: $30–$75 per event
These ranges are illustrative examples. Actual costs vary significantly based on product value, labor rates, shipping distances, and operational context.
Step 3: Estimate Event Rates
Event rates are where most buyers lack confidence—but imperfect data beats no data. Pull from available sources: returns logs with reason codes, WMS exception reports, QA sampling records, floor supervisor notes.
When logs are incomplete, run a two-week sampling study: pick a fixed number of shipments daily, tag observable outcomes (crush, separation, dimensional issues), then extrapolate conservatively. Even imperfect data beats guesswork.
When comparing a new supplier against an incumbent, use incumbent event rates as baseline and adjust based on trial results or supplier evidence. Express rates consistently: events per 10,000 shipments or percentage of orders both work.
Step 4: Compute Expected Annual Cost
The formula:
Expected Annual Failure Cost = Σ (Costevent × Rateevent × Annual Volume)
Run this calculation for each failure-event category, then sum results. Compare scenarios side by side. The difference is your TCO delta—the number revealing whether “savings” are real.
Copy/Paste Failure-Event TCO Worksheet
| Failure Event | Detection Signal | Cost Components | Cost/Event (USD) | Rate (per 10k) | Annual Volume | Expected Annual Cost |
| Carton crush requiring repack + replacement | Returns log: “damaged—box failure” | Labor, replacement, freight, credit | $35 (illustrative) | 12 (illustrative) | 500,000 | $21,000 |
| Flap separation requiring reinforcement | Floor observation / QA sample | Pack station labor | $0.80 (illustrative) | 85 (illustrative) | 500,000 | $3,400 |
| Dimensional variance causing line jam | WMS exception / downtime log | Downtime labor, throughput loss | $50 (illustrative) | 4 (illustrative) | 500,000 | $10,000 |
| Transit damage with return + concession | Service ticket: “arrived damaged” | Return freight, credit, write-off | $55 (illustrative) | 18 (illustrative) | 500,000 | $49,500 |
| Total Expected Annual Failure Cost | $83,900 |
Adapt event definitions and cost estimates to match your operation. The goal isn’t false precision—it’s a defensible comparison making hidden costs visible.
An Illustrative Break-Even Example
Consider two suppliers quoting identical box specifications:
- Supplier A unit price: $0.50
- Supplier B unit price: $0.47
- Apparent savings: $0.03 per box
- Annual volume: 1,000,000 boxes
- Projected savings: $30,000
Now define one failure event: “Damage return attributable to packaging failure” with a conservative internal cost estimate of $25 per event (replacement + reship + handling).
The arithmetic reveals the risk: $30,000 apparent savings divided by $25 per event means Supplier B can absorb 1,200 additional failures before the advantage disappears. Against a million-box volume, that’s a 0.12% increase in exception rate—a margin of error so slim it is statistically insignificant in most high-speed operations.
The numbers are placeholders, but the decision logic isn’t: tiny changes in failure frequency can overwhelm unit-price differences at scale.
Where Low-Bid Boxes Go Wrong: The Mechanisms Behind TCO Spikes
Understanding why cheap boxes cost more helps prevent the problem, not just measure it.
Spec Ambiguity Creates Quote-Time Incomparability
When RFQs lack precise specifications—board grade, ECT or burst strength, caliper tolerances, flute profile—suppliers interpret requirements differently. One bids 32 ECT single-wall; another bids 200# burst test equivalent. Both “meet spec,” but performance in your distribution environment may diverge sharply.
After award, ambiguity becomes a dispute magnet. Without named test methods and acceptance criteria, leverage disappears when performance drifts. The supplier argues they delivered what was quoted; you argue they failed to protect the product. Meanwhile, costs accumulate in operations.
For specification guidance, the TAPPI (Technical Association of the Pulp and Paper Industry) publishes industry-standard test methods that enable apples-to-apples comparison.
Material and Production Variability
Corrugated board performance depends on fiber quality, moisture content, adhesive application, and manufacturing consistency. Suppliers under cost pressure may source recovered fiber with variable properties, run production at higher speeds with less process control, or accept wider tolerances to reduce waste.
The result: boxes performing well on average but failing unpredictably at the margins. For buyers, this variability is invisible at quote time. It surfaces as inconsistent stacking strength, occasional flap separation, or sporadic crush failures.
Distribution Environment Mismatch
A box engineered for short-haul, climate-controlled distribution may fail in supply chains including ocean freight, warehouse staging in humid conditions, or aggressive handling at cross-docks. Low-bid suppliers may not ask about the distribution environment—or may not adjust specifications if they do.
Corrugated strength degrades predictably under humid conditions—seminal research archived by the Renewable Bioproducts Institute at Georgia Tech (formerly IPST) documents specific compression losses (BCT) as board moisture content rises. ASTM studies confirm the mechanism across different board configurations. A box that passes in climate-controlled distribution may fail during humid-season ocean transit or warehouse staging in tropical climates.
Documentation Gaps Prolong Disputes
When failures occur, resolution depends on evidence: test reports, lot traceability, inspection records. Suppliers competing primarily on price often underinvest in documentation systems. Longer dispute cycles, higher claims-processing labor, and weaker leverage for corrective action result. Buyers absorb these friction costs as a hidden “tax” on the low-bid relationship.
How to Prevent TCO Spikes Before Award: 5 Controls Buyers Can Enforce
The TCO model reveals what failure costs look like. These controls prevent them.
1. Spec Clarity: Define What You Will Verify
Write specifications that are precise, testable, and unambiguous. Include board grade or performance spec (ECT, burst, or Mullen), caliper and basis weight with tolerances, flute profile, and functional requirements (moisture resistance, print adhesion, stacking strength). Name test methods explicitly—ISO, TAPPI, or ASTM standards.
The ASTM International D4169 standard provides a framework for performance testing of shipping containers that can inform specification development. See also the shared checklist for corrugated box RFQs in the PaperIndex Academy.
2. Evidence Pack at Quote Time
Require suppliers to submit supporting documentation with quotes—not after award:
- Recent test reports from an accredited lab (or in-house lab with documented calibration)
- Process capability data if available
- References from customers with similar distribution profiles
The evidence pack filters out suppliers who can’t substantiate quotes and creates a baseline for post-award monitoring.
3. Sampling and Trial Runs Tied to Acceptance Criteria
Before awarding volume, run a controlled pilot. Define trial parameters in advance: sample size, duration, acceptance criteria, and who evaluates results. Use failure-event definitions from the TCO model as the basis for acceptance.
A well-designed trial costs relatively little and reveals performance gaps that quotes and certifications can’t predict. For related guidance, see why ‘cheap’ boxes cost more in the long run.
4. Scorecards and Drift Monitoring Cadence
Establish a supplier scorecard tracking metrics tied to your TCO model: damage rates, returns by reason code, QA exceptions, on-time delivery. Review on a regular cadence—monthly or quarterly depending on volume—and define thresholds triggering escalation.
Drift is normal; undetected drift is expensive. Monitoring catches performance degradation early.
5. Decision Memo Structure That Finance and Ops Can Sign
When recommending a supplier—especially one that isn’t lowest bidder—document the rationale in a format stakeholders outside procurement understand:
- Unit-price comparison
- Expected failure-cost delta (from TCO model)
- Controls for performance verification
- Monitoring cadence
A decision memo that finance and operations can sign survives scrutiny. It also protects when the next low-bid quote arrives.
FAQ: Unit Price vs TCO for Corrugated Packaging
How can I model TCO without perfect data?
Start with available data—returns logs, WMS exception codes, floor supervisor observations. Use conservative estimates and label them illustrative. The objective is to provide actionable insight that reveals whether unit-price differences can survive modest failure-rate changes. Refine estimates as you collect data over time.
What if my returned data is noisy or inconsistent?
Noisy data usually means inconsistent reason codes or missing root-cause attribution. Work with returns teams to improve coding discipline, or run a short-term sampling study—physically inspect a subset of returns to categorize failure modes. Even a few weeks of clean data can inform the model.
How do I justify switching from the low-bid supplier?
Use the TCO model to quantify expected failure-cost delta. If the higher-priced supplier’s expected failure costs are lower by more than the unit-price premium, the switch is defensible. Document this in a decision memo showing methodology, assumptions, and monitoring plan.
Which metrics matter most for e-commerce vs 3PL operations?
For e-commerce, damage-related returns and customer experience costs typically dominate—the box is the brand’s first physical impression. For 3PL operations, throughput impacts (line jams, downtime, pack-out rate) often matter more because they affect capacity utilization and SLA compliance. Tailor failure-event definitions accordingly.
How do I run a low-risk pilot without disrupting peak season?
Schedule pilots during lower-volume periods with operational slack. Define limited scope (single SKU, single facility) and short duration (four to six weeks is often sufficient). Validate failure rates against the TCO model before committing volume during peak.
While unit price offers the path of least resistance for procurement audits, it remains a fragmented metric that ignores the operational friction of sub-spec materials. The real cost of packaging lives in the failures it prevents or permits: the downtime, returns, labor, and risk.
A defensible sourcing decision doesn’t ignore price. It measures what price alone misses, builds controls to prevent hidden costs, and documents rationale in terms finance and operations can sign.
Ready to connect with suppliers who can substantiate performance claims? Explore corrugated box suppliers on PaperIndex—a neutral marketplace connecting buyers with verified suppliers across the global paper and packaging industry.
Disclaimer: This article provides educational guidance on procurement methodology and cost analysis. Numeric examples are illustrative and should be adapted to specific operations.
Our Editorial Process:
Our expert team uses AI tools to help organize and structure our initial drafts. Every piece is then extensively rewritten, fact-checked, and enriched with first-hand insights and experiences by expert humans on our Insights Team to ensure accuracy and clarity.
About the PaperIndex Insights Team:
The PaperIndex Insights Team is our dedicated engine for synthesizing complex topics into clear, helpful guides. While our content is thoroughly reviewed for clarity and accuracy, it is for informational purposes and should not replace professional advice.