📌 Key Takeaways
Finance rejects quality requests lacking definitional clarity, repeatable assumptions, and measurable controls—not because they oppose quality.
- Scattered Costs Hide Total Impact: Quality failures disperse across customer service, operations, and sales budgets, causing Finance to underestimate aggregate costs when no single owner tracks them.
- Prevention Beats Inspection Economics: Inspection increases appraisal costs without reducing upstream variance, while enforceable specifications with testable tolerances prevent failures before materials arrive.
- Ranges Trump False Precision: Documented cost ranges with explicit assumptions earn CFO credibility faster than single-point estimates lacking measurement methodology.
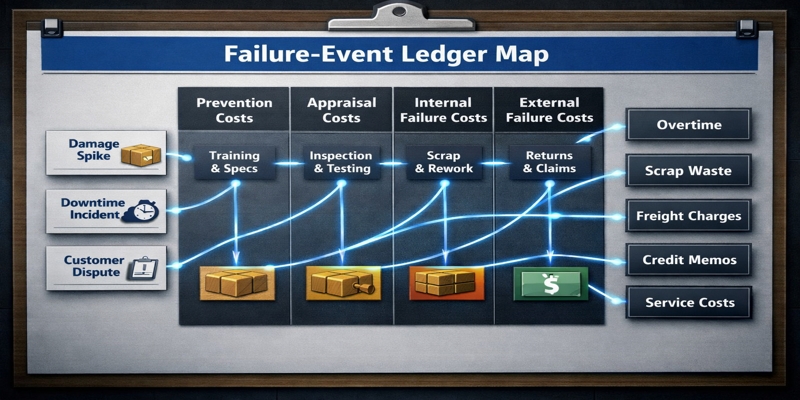
- The Failure-Event Ledger Map: Linking 3–5 specific incidents to P&L cost lines transforms operational complaints into finance-auditable risk categories within 30 days.
- Cross-Budget Traceability Wins Approval: Tracing one damage spike through rework, reshipment, credits, and service time reveals enterprise risk touching multiple budget owners.
Quality spend becomes defensible when failure events map to cost categories with measurement plans.
Procurement managers and operations leads building CFO-ready quality cases will gain the justification framework and one-page template here, preparing them for the implementation metrics that follow.
Operations feel packaging quality as disruption—jams, downtime, rework, damage. Imagine avoiding a messy dispute with a supplier because you have a signed, technical spec sheet that definitively proves the batch was non-compliant. For guidance on creating these foundational documents, see how to create your mill spec sheet. Finance hears it as a spend request without a repeatable model. Alignment comes faster when the conversation becomes ledger-style: failure events → cost categories → controls → measurement.
This gap between operational reality and financial approval isn’t a people problem. It’s a model problem. Finance doesn’t reject quality spend because they don’t care about uptime—they reject it because requests arrive as preferences rather than quantified risks with measurable controls. The solution isn’t better persuasion. It’s a shared justification framework that translates packaging failures into ledger-visible cost categories.
Specification-Based Quality Assurance (SBQA) is a protocol for defining and verifying material specifications—such as Burst Strength (Mullen) and Edge Crush Test (ECT)—to ensure performance consistency. Imagine avoiding a messy dispute with a supplier because you have a signed, technical spec sheet that definitively proves the batch was non-compliant. Creating enforceable corrugated box specs that name exact test methods prevents such disputes from arising in the first place. Ensuring this oversight requires integrating standardized technical requirement sheets into every procurement request.
Why Finance Says “No” (Even When Operations Is Right)
Finance operates under governance constraints that Operations often underestimates. A CFO-friendly request answers three questions:
- What failure events are happening?
- Where do their costs land in the P&L?
- What controls reduce variance—and how will that be measured in 30 days?
Budget approval requires definitional clarity (what exactly are we buying?), repeatable assumptions (can we verify this next quarter?), and measurable controls (how will we know it worked?). When Operations presents quality concerns as ‘we’re seeing more damage’ or ‘the boxes aren’t running well,’ Finance hears unquantified risk with unclear scope and no measurement plan. Strategic frameworks for resilient corrugated box sourcing help translate these operational pain points into quantified business cases that Finance can evaluate. The rejection isn’t disagreement—it’s an inability to approve something that can’t be audited.
While quality is often dismissed as a subjective operational preference, it transitions into a financial liability when failure events are mapped to specific P&L cost categories. But quality becomes a Finance decision the moment you can map failure events to cost categories and propose prevention controls with a measurement plan. The path forward requires translating technical failures into finance-native categories: cost buckets, variance ranges, and risk reduction scenarios.
The Core Model: Cost of Quality (COQ) Reframed for Packaging

The Cost of Quality framework, derived from the Feigenbaum P-A-F model, functionally divides quality-related costs into three primary dimensions, with ‘Failure’ subdivided to create four practical categories. For packaging operations, each maps directly to trackable failure events:
| Bucket | Packaging examples | Typical “where it shows up” |
| Prevention | Method-named specs, qualification gates, change control | Quality/engineering programs, training |
| Appraisal | Dock checks, sampling, incoming verification | QA labor, third-party tests |
| Internal failure | Downtime, rework, scrap, overtime | Manufacturing variance, scrap/rework |
| External failure | Claims, credits, reshipments, SLA penalties | Logistics, customer service, credits |
Prevention Costs — Investment to avoid failures before they occur. In packaging, this includes spec discipline through standardized mill spec sheets, supplier qualification protocols, and training on incoming inspection procedures.
Appraisal Costs — Inspection and verification activities. These cover dock testing for moisture, caliper, and burst strength, sampling protocols for incoming shipments, and third-party lab verification for critical specifications.
Internal Failure Costs — Problems caught before reaching customers. Line downtime from board variability, rework hours and overtime to meet shipping windows, and scrap from non-conforming materials all fall here.
External Failure Costs — Problems reaching customers. Returns, replacements, reshipments, customer credits, and SLA penalties belong in this bucket.
Here’s the insight that changes budget conversations: most quality costs hit budgets that procurement doesn’t own. Returns hit customer service. Downtime hits operations. Credits hit sales. A peak-season damage spike triggers customer credits, reshipments, and overtime—costs scattered across departments. When these costs disperse across the organization, Finance underestimates the total because no single owner aggregates them.
Quality systems typically require planned processes and performance evaluation, which fits the COQ approach.ISO quality management standards (specifically ISO 9001:2015) prioritize risk-based thinking and prevention, aligning with the ‘1-10-100 Rule’ which posits that catching failures downstream costs significantly more than preventing them upstream. For Finance audiences, COQ is also discussed as a quality management toolset alongside other improvement frameworks.
A packaging line jam caused by board variability costs downtime minutes that can dwarf unit-price savings. The total cost of ownership approach reveals why the cheapest box often becomes the most expensive choice.
Objection Handling: The Five Questions Finance Will Ask
“Show me the numbers.”
This is fair. Start by building a “failure-event ledger map” using existing data—even imperfect data works. Pull damage-on-arrival rates from receiving, downtime minutes from production logs, and credits from customer service. List 3–5 failure events (damage spikes, downtime events, disputes), and for each, identify cost lines (labor/overtime, scrap, freight, credits).
Express ranges rather than false precision: “Based on Q3 data, damage-related costs fall between $15,000 and $22,000 monthly across returns, rework, and credits.” Ranges with documented assumptions carry more credibility than single-point estimates.
The immediate priority is constructing a failure-event ledger map for a single SKU lane, pulling a 30-day extract of incidents. Request a 30-day extract of DOA incidents, downtime logs, and credit memos tagged to packaging failures.
“We can just inspect more.”
Inspection catches problems after they arrive—it doesn’t prevent them. Without enforceable specifications, you’re measuring drift without governance. For practical guidance on verifying corrugated box quality at the dock, a structured testing protocol helps catch issues early—but prevention through specification discipline remains the priority. A supplier can ship material that passes today’s inspection but fails under stress during peak season, because “acceptable” was never defined with testable tolerances.
Separate governance layers: prevention (enforceable specs), appraisal (fast receiving verification), and corrective action (supplier accountability). Inspection alone increases appraisal cost but doesn’t reduce upstream variance. This addresses the misconception that inspection alone can replace specification discipline. For guidance on defining enforceable corrugated box specs, a structured approach helps close this gap.
A secondary objective involves auditing current spec sheets to ensure they move beyond product descriptions into testable tolerances. Standardize a dock protocol for high-leverage checks (moisture, caliper/thickness, dimensions) and evidence capture before acceptance transfers risk.
“We don’t have clean data.”
Perfect data isn’t required for a credible business case. Use ranges and sensitivity analysis: “If our true failure rate falls between 1.5% and 3%, the cost impact ranges from X to Y.” Use proxies already tracked (downtime minutes, overtime hours, credits). Show low/expected/high assumptions and commit to a 30-day plan to replace estimates with actuals.
Document assumptions explicitly. Finance prefers honest uncertainty over false precision—it signals understanding of the model’s limits. The question of what metrics can be collected in 30 days has a practical answer: start with DOA rate, downtime minutes, rework hours, and credit memos.
Establishing a baseline requires identifying three accessible data sources to create a shared log of event frequency and cost ranges.
“This is an Ops issue.”
Show the cross-budget impact. When a damage spike hits, it triggers customer credits (sales budget), reshipments (logistics budget), and overtime (operations budget). Trace one incident across functions: rework → reshipment → credit → customer service time. The Cost of Quality approach in finance contexts makes these distributed costs visible as a single category. Quality isn’t an Ops preference—it’s enterprise risk touching multiple P&L lines.
Finally, map the primary three failure events to the budget lines they impact, using the next high-risk period as a catalyst for the business case.
“Why now?”
Risk concentration changes. Peak season amplifies failure costs. Automation investments increase sensitivity to material variability—a line that tolerated ±5% moisture variation manually may jam at ±3% when automated. Supplier drift compounds over time when specs aren’t enforced. The cost of inaction isn’t static.
Do a “risk lane” test (peak volume, long lead times, automation sensitivity, supplier drift) and prioritize one control upgrade that reduces variance without a big program.
Action for next week: Identify your next high-risk period and frame the business case around that timeline. Pick one risk lane and run the measurement plan below.
CRA: CFO-Ready “Quality Investment One-Pager” Template
Copy and adapt this template for internal budget requests. The structure speaks finance language—risk, variance, cost categories, and sensitivity—rather than operational jargon alone. Keep this to one page. Use ranges. Treat it like a decision memo.
Quality Investment One-Pager
Decision Requested: [Specific spend or policy change]
Failure Event(s) Driving Request: [Specific incidents with dates and quantities]
Cost Mapping (COQ Buckets):
– External Failure Costs: $______ (returns, credits, reshipments)
– Internal Failure Costs: $______ (downtime, rework, scrap, overtime)
– Current Appraisal Costs: $______ (existing inspection activities)
– Proposed Prevention Costs: $______ (this investment request)
Mitigation Controls:
– Standardized mill spec sheets with testable tolerances
– Dock verification protocol for incoming shipments
– Supplier accountability clauses tied to specifications
Expected Impact: [Risk reduction statement with scenario ranges, not guaranteed savings]
Measurement Plan (30 Days):
– DOA rate (target: <X%)
– Downtime minutes linked to packaging (target: <Y per month)
– Credit memos tagged to packaging failures (target: <$Z monthly)
– Rework hours (target: baseline minus W%)
Owner(s): [Ops lead / Procurement / Finance inputs]
Assumptions & Sensitivity: [What changes the result; what happens if assumptions prove wrong]
A question that often arises: how do we avoid over-specifying and wasting money? The solution involves calibrating specifications to functional requirements rather than over-engineering beyond the stressors of the logistics cycle. Spec discipline frameworks for corrugated box sourcing help calibrate this balance by defining the minimum acceptance window that protects runnability and customer outcomes, then validating with measured results.
Implementation: What to Measure in the Next 30 Days

Start with a minimum viable measurement plan. Perfect systems aren’t required—baseline data that’s defensible and repeatable is enough.
| Metric | Definition | COQ Bucket | Data Source | Cadence | Owner |
| DOA rate (damage on arrival) | % inbound lots needing conditional accept/reject | External/Internal Failure (proxy) + Appraisal | Receiving log/photos | Every inbound | Ops |
| Downtime minutes (packaging-linked) | Minutes tagged “packaging-related” | Internal Failure | Production logs/line downtime log | Daily | Ops |
| Rework hours | Hours spent reworking packaging issues | Internal Failure | Labor tracking/shift report | Weekly | Ops |
| Credits/claims (count + $) | Packaging-related credits/reshipments | External Failure | Customer service/credit memos/CS tickets | Weekly | Finance |
Map each metric to a COQ bucket so Finance sees the connection between operational signals and ledger categories. Keep definitions consistent across shifts. Track frequency even if cost starts as a range. Even imperfect data builds the case—because it shows measurement, not guessing. For companies managing pharmaceutical packaging compliance, measurement plans must also address regulatory requirements and evidence retrieval during QA release.
For detailed guidance on creating standardized mill spec sheets, structured templates accelerate this process.
Next Steps: From Justification Model to Spec-True QA Program
The one-pager gets budget approval. Sustaining results requires embedding spec discipline into the sourcing process—what might be called avoiding the ‘cheap box trap’ that causes downstream failures. Understanding why unit price spikes your total cost of ownership helps make this case to Finance.
Quality spend becomes defensiblMatch specifications to actual pee when failure events map to cost categories and proposed controls include a measurement plan. The model doesn’t require perfect data. It requires shared definitions, honest ranges, and cross-functional ownership. With a one-page justification framework, Operations urgency and Finance governance align around the same numbers.
By the end of this process, you should be able to translate packaging quality failures into ledger-visible cost buckets rather than anecdotes, answer Finance objections with methods rather than claims, and copy a one-page justification template directly into an internal deck or email.
Frequently Asked Questions
What is “cost of quality” and how is it different from “cost of poor quality”?
Cost of Quality (COQ) encompasses all costs related to achieving quality—both the investment in prevention and appraisal, and the costs of failure. “Cost of Poor Quality” (COPQ) refers specifically to failure costs. COQ is the broader framework; COPQ is a subset focusing on what goes wrong. The full COQ view helps Finance compare “spend that prevents” versus “spend that cleans up.”
Why doesn’t inspection alone solve quality drift?
Inspection is an appraisal activity—it measures what arrives but doesn’t govern what should arrive. Without enforceable specifications defining acceptable tolerances, inspection catches symptoms without addressing root causes. Suppliers can drift gradually when “acceptable” remains undefined. The business case strengthens when prevention (enforceable specs) and corrective action (supplier accountability) reduce variance, while inspection remains a verification layer.
What metrics can we collect in 30 days to justify quality spend?
Four accessible metrics provide a solid baseline: damage-on-arrival rate from receiving logs, downtime minutes linked to packaging from production records, rework hours from labor tracking, and credit memos tagged to packaging failures from customer service. Map each to a COQ bucket. Keep definitions consistent across shifts and track frequency even if cost starts as a range.
How do we avoid over-specifying and wasting money?
Match specifications to actual performance requirements rather than theoretical ideals. Understand what stresses your supply chain actually subjects packaging to, then specify tolerances that address those stresses—no more, no less. For practical guidance on creating spec sheets that work and aligning procurement and engineering priorities, structured checklists prevent both under- and over-specification. Define the minimum acceptance window that protects runnability and customer outcomes, then validate with measured results. Tightening a spec without data can raise cost without reducing risk.
Disclaimer:
This content is for informational purposes only and should not replace professional advice.
Our Editorial Process:
Our expert team uses AI tools to help organize and structure our initial drafts. Every piece is then extensively rewritten, fact-checked, and enriched with first-hand insights and experiences by expert humans on our Insights Team to ensure accuracy and clarity.
About the PaperIndex Insights Team:
The PaperIndex Insights Team is our dedicated engine for synthesizing complex topics into clear, helpful guides. While our content is thoroughly reviewed for clarity and accuracy, it is for informational purposes and should not replace professional advice.