
📌 Key Takeaways
Unpredictable per-order costs stem from vague specifications that invite interpretation, rework, and post-award negotiations—not from market volatility.
- Test-Method-Named Windows Replace Debates with Data: Naming exact test methods (ISO 536 for basis weight, ISO 287 for moisture) with acceptance bands (e.g., 118–122 g/m²) transforms receiving from investigation to verification, eliminating subjective judgment calls.
- Specification Drift Compounds into Hidden Yield Loss: A 1% basis weight variance on a 24-ton order behaves like 0.2 reel shortfall, forcing extra orders and changeovers that inflate annual costs without changing the quoted price per ton.
- Evidence-First RFQs Shift Risk Before Award: Requiring 7–14 day lab certificates with measurement uncertainty, 90-day OTIF metrics (≥95%), and documentation accuracy (≥98%) replaces supplier promises with verifiable operational proof.
- Freight Volatility Flips Supplier Rankings: Normalizing all quotes to delivered basis and stress-testing ocean freight at +30%, +40%, and +50% scenarios reveals which supply chains remain cost-effective when rates surge mid-contract.
- Acceptance Windows Align QA and Procurement Instantly: Binary pass/fail decisions based on documented tolerance bands (6.5–8.5% moisture, not “7.5% target”) eliminate deviation approval bottlenecks and accelerate release to production.
Spec discipline converts micrometer-level technical precision into predictable financial outcomes through enforceable contract language and systematic evidence verification.
SMB containerboard converters, procurement managers, and quality leads responsible for kraft paper and packaging inputs will find a complete operational framework here, preparing them for the detailed implementation protocols.
Every kraft paper or containerboard purchase order carries hidden cost variance. A supplier quotes $950 per ton, FOB port. You budget accordingly. Then the shipment arrives: basis weight runs 2% heavy, moisture sits outside your window, and three reels show edge damage. Suddenly, your yield drops, QA flags the lot, and you’re negotiating remedies instead of running production. That $950 just became $1,020 to your door—and you’re two days behind schedule.
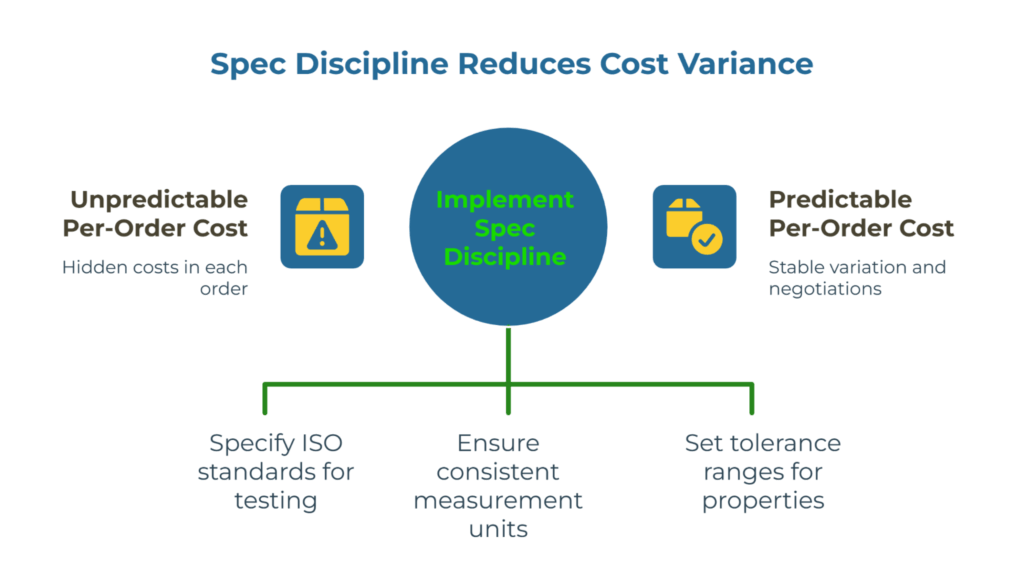
The root cause isn’t the supplier’s intent or the market’s volatility. It’s the absence of what we call spec discipline: the practice of naming exact test methods (ISO 536 for basis weight, ISO 2758 for burst strength, ISO 287 for moisture), stating units clearly, and defining acceptance windows—not single-point targets—for every critical property. When procurement writes “70 g/m² kraft liner” without specifying the method, tolerance band, or supporting evidence, they invite interpretation. And interpretation compounds into cost.
Spec discipline stabilizes variation and negotiations to produce predictable per-order cost. It converts technical precision into financial confidence by answering three questions upfront: Which exact properties matter? What acceptance range keeps our line running? What evidence proves the mill can hold that range, lot after lot? When those answers are documented—method by method, with tolerances and fresh lab certificates—procurement and quality speak the same language, suppliers bid on the same basis, and receiving becomes verification instead of investigation.
Executive Brief: The Micrometer on Money
Spec discipline means naming the test method (ISO/TAPPI), units, and a clear acceptance window for the handful of properties that actually move cost. Done well, three levers stabilize: yield (grams of fiber per square meter determines area, which determines boxes per ton), rework and claims (curl, jams, adhesion and print defects), and negotiation stability (evidence replaces promises; quotes normalize to your door).
Day-to-day application: After a week of humid transit, receiving checks moisture per ISO 287 against a documented 6.5–8.5% window. Pallets reading outside that range are conditioned per ISO 187/186 practices before release to converting. The result: curl-related line calls drop, speed holds, and a potential claim is avoided because acceptance criteria were method-named and known in advance.
Consensus Kit: Single Number vs Method-Named Window
| Approach | What It Says | What Happens on the Floor | Business Outcome |
| Single Number (e.g., “120 g/m²”) | A target with no test basis | Disputes over “how measured” | Unstable cost and eroding relationships |
| Method-Named Window (e.g., ISO 536, 118–122 g/m²) | A measurable acceptance band | QA and Procurement enforce the same thing | Fewer debates, predictable cost |
Risk-mitigation essentials for every RFQ: Attach method IDs to each property. Request 7–14 day lab certificates with measurement uncertainty. Normalize quotes to deliver basis and stress-test freight scenarios at +30%, +40%, and +50%.
Windows, Not Single Numbers

Single-point specifications fail in practice because manufacturing processes deliver distributions, not constants. A mill targeting 70.0 g/m² will produce reels between 69.2 and 70.8 g/m² due to natural variation in forming section flow, dryer profiles, and measurement itself. When your RFQ demands “exactly 70 g/m²” without stating a tolerance, you’ve created three problems: the supplier doesn’t know your actual acceptance range, QA lacks enforcement criteria, and every borderline result triggers a negotiation.
Method-named acceptance windows solve this. Instead of “70 g/m² basis weight,” you write “70 ± 2% g/m² per ISO 536 (oven-dry method, 23°C/50% RH conditioning per ISO 187).” Now the specification is enforceable. The method defines how to measure, the units eliminate ambiguity, and the ± band tells both parties what passes and what fails. Your QA team and the supplier’s lab follow the same protocol, compare results within stated measurement uncertainty, and approve or reject based on objective criteria.
Why Test-Method-Named Windows Are Enforceable
Naming the test method makes the spec portable and repeatable. TAPPI T 410 and ISO 536 both measure grammage, but they condition samples differently and report to different decimal precision. A mill’s certificate showing “70.4 g/m² per TAPPI T 410” can’t be directly compared to your internal check using ISO 536 unless you’ve agreed on the method upfront. When disputes arise—and they will—a method-ID’d spec lets you point to the standard’s procedure, request an independent referee test using the same method, and resolve the issue with data instead of opinions.
Acceptance bands further reduce friction by acknowledging real-world capability. A mill with a process performance index (Ppk) of 1.33 for basis weight—a common standard for a capable process—will produce 99.9937% conforming material (or less than 64 parts-per-million defective) if you set the tolerance at ±3% of the target. Tighten that window to ±1% and rejection rates climb, forcing the supplier to pad their quote to cover waste or pushing them to decline the business entirely. Your job is to define the minimum window your converting process actually requires—not the tightest window you can imagine—so suppliers can bid competitively without assuming excessive risk.
Use method-named windows for the properties that drive your operation:
- Grammage (ISO 536 / TAPPI T 410): Typical window 118–122 g/m² for a nominal 120 g/m² liner
- Moisture Content (ISO 287): Typical window 6.5–8.5%
- Bursting Strength (ISO 2758): Set window aligned to grade requirements
- Cobb Water Absorbency (TAPPI T 441): Typical window 25–40 g/m² (60 s test) depending on application
These examples are illustrative for teaching purposes; your actual windows depend on product requirements and process capability.
Acceptance Bands vs Targets: Faster Approvals, Fewer Debates
When receiving inspects a shipment, they compare test results to the acceptance window. If the certificate shows 69.5 g/m² and your spec allows 68.6–71.4 g/m² (70 ± 2%), the lot passes. No phone calls, no requests for deviation approvals, no plant manager reviewing edge cases. The decision is binary and fast.
Contrast that with single-point targets. A certificate showing 69.5 g/m² against a “70 g/m²” spec immediately raises questions: Is that close enough? What’s our internal policy on deviations? Should we contact the supplier? Meanwhile, production waits, and your actual tolerance—the one you never documented—gets revealed through inconsistent accept/reject decisions that erode supplier trust and extend lead times.
For moisture content, windows become even more critical. Paper equilibrates with ambient humidity during storage and transit, so a mill’s certificate showing 7.2% moisture per ISO 287 may read 8.1% when you test it three weeks later at your facility. If your spec states “7.5% moisture” without a range, you’ll reject material that’s functionally identical to what you approved last month. A window approach—”moisture 6.5–8.5%, target 7.5%, per ISO 287″—accounts for this natural drift and keeps your line running.
Where Specs Hit Your Wallet: A Simple Cost Mini-Model
To make the business case concrete, consider a single 24-metric-ton purchase order for 70 g/m² kraft linerboard. The calculations below use illustrative numbers to demonstrate the relationship between spec windows and cost outcomes; your actual figures will vary based on conversion process, freight lane, and contractual terms.
Basis Weight ±1%: Yield Math on a Single PO
Assume you budget for 24,000 kg of usable liner at 70.0 g/m². If the delivered material runs 1% heavy at 70.7 g/m², you’re paying for 24,000 kg but receiving approximately 1% less surface area because each square meter weighs more than specified. Nominal area from a given mass is proportional to 1/grammage, so the yield shortfall behaves like roughly 240 kg of lost material at the target grammage.
In practical terms, if your typical reel weighs 1,200 kg, that 240 kg shortfall represents 0.2 reel. Over the course of a year with 15 similar orders, this compounds: you’re forced to order extra reels, schedule additional changeovers, and occasionally expedite top-up shipments. For a $950/ton delivered cost, that 1% overweight condition costs you roughly $228 in lost yield on this order alone—enough to fund incoming inspection improvements or tighten RFQ tolerances with selected mills when scaled across annual volume.
Conversely, if the material runs 1% light at 69.3 g/m², you gain yield but may sacrifice performance. Lighter basis weight typically correlates with lower burst strength and reduced stacking strength in finished boxes. If that leads to even one customer claim per quarter—say $1,200 in rejected pallets—you’ve erased the yield benefit and added operational chaos.
Moisture Out of Window: Less Dry Fiber and Runnability Risk
Moisture content governs both dimensional stability and the actual amount of working fiber you receive. Dry fiber per ton equals 1,000 kg × (1 – moisture fraction). At 7.5% moisture, you receive 925 kg of dry fiber per ton. At 8.5% moisture, that drops to 915 kg—approximately 1.08% less fiber doing the structural work. Across a 24-ton order, that’s roughly 260 kg less dry fiber.
When linerboard arrives with moisture above your 6.5–8.5% window—say 9.5%—the material may curl as it equilibrates with your plant’s humidity, causing jams at the single-facer, misalignment in the corrugator, and adhesive failures in the glue station. A single two-hour downtime event to clear jams and re-thread the line costs approximately $2,400 in lost throughput for a mid-sized operation running 150 linear meters per minute. If moisture drift triggers downtime once per month, the annual cost reaches $28,800.
Compare that to the $4,000 annual investment in moisture meters at receiving and a 48-hour acclimatization buffer for out-of-spec reels. The ROI case writes itself.
Conversely, material arriving too dry—say 5.8% moisture—becomes brittle, increasing the risk of sheet breaks during corrugating and reducing the adhesive bond between liner and medium. The result: lower box compression strength and potential field failures that damage customer relationships and generate claims.
Cobb Value Too High: Adhesion, Print, and Rework
Cobb value measures water absorbency. For printed linerboard or applications requiring strong starch adhesion, you might specify Cobb₆₀ ≤ 35 g/m² per TAPPI T 441. If material tests at 42 g/m², the surface absorbs ink and adhesive too quickly, causing print bleed and weak bond lines. Rework rates climb, and you’re left with two choices: run the material and accept quality issues, or hold the lot and negotiate a credit while scrambling for replacement stock.
Assume rework affects 8% of production when Cobb exceeds spec, and your shop processes $120,000 in monthly material value. The rework exposure is $9,600 per month, or $115,200 annually. A tighter RFQ spec with pre-award verification—requesting Cobb test results from the supplier’s last three production lots—reduces that risk to near zero.
Spec Window to Cost Signature: The Complete Picture
| Property (Method) | Illustrative Window | Primary Operational Effect | Cost Signature |
| Grammage (ISO 536 / TAPPI T 410) | 118–122 g/m² | Area-per-ton and box count | Extra reels + changeovers; hidden yield loss |
| Moisture (ISO 287) | 6.5–8.5% | Curl/brittleness; jams; glue set | Line stops; claims; scrap |
| Burst (ISO 2758) | Window per grade | Compression/stack resilience | Damage-in-transit; credits/returns |
| Cobb 60s (TAPPI T 441) | 25–40 g/m² | Adhesion and print behavior | Glue/ink overuse; rework |
| Splice/Edge Quality (Visual + photo spec) | No torn edges; taped splices only | Web breaks; safety | Stop-start waste; labor overtime |
| Documentation Accuracy (COA + Lab Certs) | ≥98% correct docs | Release latency; audit risk | Demurrage; admin rework |
From Investigation to Verification: Evidence to Demand Upfront
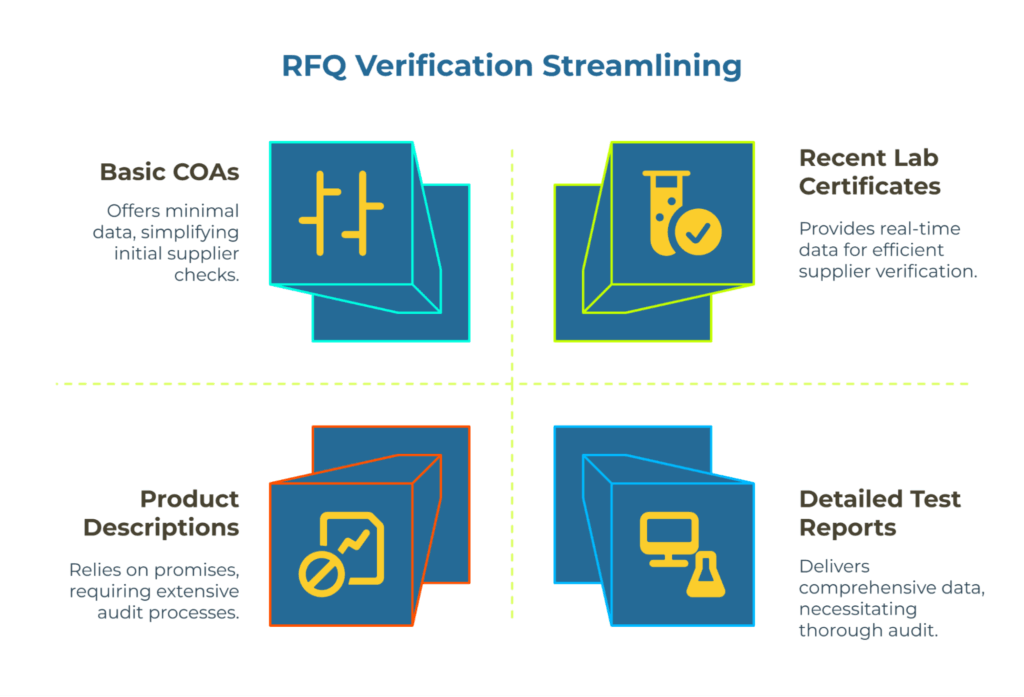
Traditional RFQs request product descriptions and prices. Spec-disciplined RFQs request evidence: data that proves the mill can deliver the specified properties, not just promises that they will. This shift transforms receiving from an investigative audit into a streamlined verification step.
COA Plus Fresh Lab Certificates
Every quote should include a Certificate of Analysis (COA) showing the mill’s standard capability for your grade. But COAs alone aren’t sufficient because they often represent historical averages or best-case production runs. You need recent, method-specific lab test reports from the supplier’s last 7–14 days of production.
Request these reports explicitly in your RFQ: “Attach lab certificates dated within 14 days, showing test results for ISO 536 basis weight, ISO 2758 burst, ISO 287 moisture, and TAPPI T 441 Cobb, including measurement uncertainty and sample size.” When suppliers provide this evidence, you can calculate their actual process variation, compare it to your acceptance windows, and make an informed award decision.
The certificates should also state the conditioning environment (23°C/50% RH per ISO 187 or equivalent) because paper properties shift with temperature and humidity. A basis weight measured at 30°C/70% RH isn’t directly comparable to your receiving test at 20°C/45% RH. Method alignment eliminates that ambiguity.
Machine Conditions, Splice Quality, and Edge Photos
Physical inspection evidence matters too. Request photos showing:
- Splice condition: Clean, centered splices with minimal overlap indicate good winding practice. Ragged or off-center splices increase the risk of sheet breaks during unwinding.
- Edge quality: Smooth, dust-free edges reduce contamination risk and improve runnability. Torn or fibrous edges suggest dull slitter knives or poor tension control at the mill.
- Core fit and reel geometry: Proper core engagement and consistent reel diameter prevent telescoping during transit and ensure smooth unwinding at your equipment.
These visual checks take 10 minutes but reveal mill housekeeping and quality discipline. Suppliers who balk at providing photos are often hiding capability gaps.
Supplier Track Record: OTIF and Documentation Accuracy
Finally, request the supplier’s 90-day performance metrics: on-time-in-full (OTIF) delivery rate and documentation accuracy (percentage of shipments where submitted certificates matched independent receiving tests within measurement uncertainty). A supplier with 95% OTIF and 98% documentation accuracy has demonstrated operational consistency. One with 78% OTIF and 85% documentation accuracy will cost you more in expediting, claims, and unplanned downtime, even if their quoted price is lower.
Ask for this data in your RFQ. Reputable brown paper suppliers and brown paper manufacturers track these metrics and will share them. Suppliers who can’t or won’t provide the data are signaling gaps in their systems. Use illustrative targets of ≥95% OTIF and ≥98% documentation accuracy as benchmarks when calibrating supplier risk.
RFQ and Contract Language That Prevents Debates
Specification discipline extends into your commercial documents. RFQs and purchase contracts must translate technical requirements into enforceable legal terms so both parties understand what constitutes conformance and what triggers remedies.
Copy-Ready Clauses: Methods, Units, Tolerances, Remedies
Here’s a contract clause template you can adapt by replacing bracketed items with your own values:
Specification Basis
Supplier shall certify the following properties per stated standards and units. Acceptance is defined by the window shown.
- Grammage: [118–122] g/m² by ISO 536 (or TAPPI T 410)
- Moisture Content: [6.5–8.5]% by ISO 287
- Bursting Strength: [X–Y] kPa by ISO 2758
- Cobb (60s): [25–40] g/m² by TAPPI T 441
Supplier’s COA and an independent or in-house lab certificate dated within 7–14 days of shipment shall report values, test method IDs, units, and measurement uncertainty.
Lot Acceptance and Remedies
Acceptance: Lots within the window are accepted. Lots outside the window are, at Buyer’s option: (a) returned at Supplier’s cost, (b) discounted per [remedy schedule], or (c) reworked/replaced within [X] days.
Disputes: Where results differ, a third-party lab (ISO/IEC 17025 scope covering the named methods) using the named method will be final and binding; costs split equally unless results favor one party by >10%, in which case the non-conforming party bears full cost.
Commercial Normalization
Incoterms: One Incoterm per RFQ/quote (specify CIF [Your Port], Incoterms® 2020, or equivalent).
To-Door Normalization: Supplier shall provide a delivered comparison: base price, freight, insurance, duties, and predictable accessorials documented separately. Buyer will evaluate on delivered-basis equivalence.
Freight Stress-Test: Supplier acknowledges Buyer will stress-test freight at +30% / +40% / +50% scenarios during award evaluation.
Documentation and Traceability
Traceability: Each reel shall carry reel ID, production date, machine conditions, and splice/edge quality notes with photos available upon request.
Data Integrity: Documentation accuracy below [98%] over a rolling 90 days triggers a CAPA review.
This language achieves four goals: method IDs eliminate ambiguity, acceptance windows are explicit, dispute resolution is predefined, and remedies give you options. The upfront effort—perhaps 30 minutes per specification—prevents months of back-and-forth when a problem shipment arrives.
Runnability Safeguards: Storage, Conditioning, and Moisture Windows
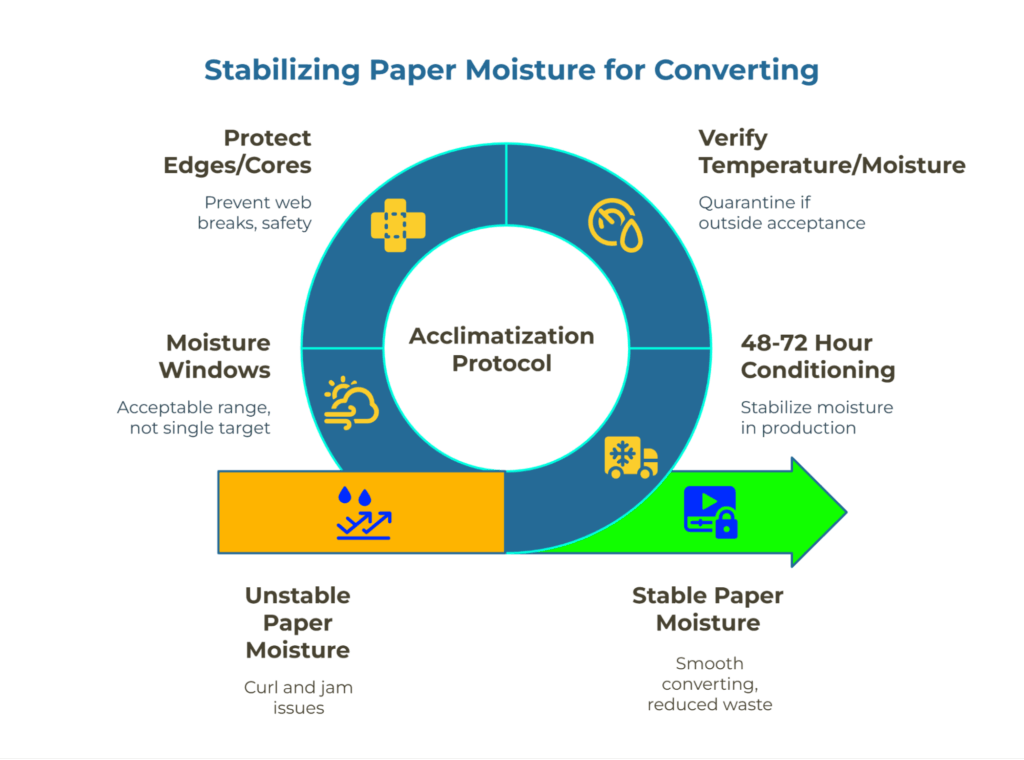
Even perfectly manufactured material can fail at your converting line if it’s stored or conditioned improperly. Paper is hygroscopic: it absorbs or releases moisture until it equilibrates with ambient air. A reel that arrives at 7.2% moisture may read 9.1% after three weeks in a humid warehouse, triggering the curl and jam issues discussed earlier.
48–72 Hour Acclimatization Protocol
Best practice calls for conditioning incoming reels in your production environment—ideally 23°C and 50% relative humidity per ISO 187—for 48–72 hours before unwinding. This allows the paper’s moisture content to stabilize, reducing the risk of dimensional change during converting.
For high-throughput plants where 72-hour buffers aren’t practical, at minimum verify reel surface temperature and conduct a spot moisture check (ISO 287 or equivalent handheld meter) at receiving. If surface temperature differs from ambient by more than ±3°C, or if moisture sits outside your acceptance window, quarantine the lot for extended conditioning or contact the supplier before releasing it to production.
Protect edges and cores during handling. Reject reels with crushed cores or torn edges per your visual specification to prevent web breaks and safety incidents.
Moisture Windows vs Single-Point Targets
Recall that moisture content isn’t a constant; it’s a dynamic property influenced by ambient conditions and handling. Specifying “7.5% moisture” as a single-point target creates false precision. In practice, you need material between 6.5% and 8.5% to run smoothly. The target—7.5%—represents the ideal, but the window acknowledges operational reality.
This tolerance-band thinking applies to other properties too. Burst strength “≥ 300 kPa” is a floor, not a target; exceeding it is fine, and you don’t penalize suppliers for delivering 310 kPa. Basis weight “70 ± 2% g/m²” is a true window: 68.6–71.4 g/m² all pass, and values outside that range trigger review.
Properly designed windows align your converting needs with suppliers’ capabilities and eliminate the rework-or-reject decisions that disrupt schedules and erode relationships.
Price Without Context Is Noise: Normalize and Stress-Test
A supplier quotes $920/ton FOB Shanghai. Another quotes $980/ton CIF your port. Which is cheaper? You can’t answer without knowing freight rates, insurance costs, duty rates, inland drayage, and currency exposure. Until you normalize quotes to the same delivery point and stress-test key assumptions—especially ocean freight, which can swing 30–50% in a single quarter—you’re comparing noise, not prices.
Delivered-Basis Comparison and Driver Documentation
Take every quote and add the missing cost components to reach a delivered-to-door total. For the $920 FOB Shanghai quote, you might add:
- Ocean freight: $180/ton (current 40′ container rate)
- Marine insurance: $8/ton
- Customs duty: $46/ton (assuming 5% ad valorem on CIF value)
- Inland drayage and delivery: $35/ton
Total: $1,189/ton delivered. Suddenly the $980 CIF quote, once you add $35 inland and $46 duty, lands at $1,061/ton delivered—a 12% difference that was invisible in the original FOB vs CIF comparison.
Document every assumption: which freight forwarder rate you used, which exchange rate and date, which duty schedule. Share the normalization spreadsheet with your team and with suppliers during negotiation so everyone agrees on the math. This transparency prevents post-award disputes (“We didn’t realize you’d add $180 for freight; we thought you’d use our freight partner at $145”) and aligns expectations.
Stress-Test Freight at +30%, +40%, +50%
Ocean freight is volatile. Rates that sit at $180/ton today may jump to $270/ton next quarter due to port congestion, carrier alliances adjusting capacity, or geopolitical disruptions. Before awarding a 12-month supply contract, model the delivered cost at increased freight scenarios:
| Scenario | Base (USD/t) | Freight | Insurance/Duties | Delivered | Cost Impact |
| Quoted | 650 | 100 | 20 | 770 | Baseline |
| +30% Freight | 650 | 130 | 20 | 800 | +$30/ton |
| +40% Freight | 650 | 140 | 20 | 810 | +$40/ton |
| +50% Freight | 650 | 150 | 20 | 820 | +$50/ton |
If a 50% freight increase flips your supplier ranking—the $920 FOB quote becomes more expensive than a $1,050 EXW domestic source—you’ve discovered a hidden risk. Your options: negotiate freight price caps with the supplier, split freight risk via a variable surcharge clause, or shift volume to a more freight-resilient source.
For complete methodologies on freight modeling and landed-cost frameworks, consult the price-to-door playbook and quality specs vs price: how basis weight, burst, and cobb shape your kraft paper real cost.
The Spec Discipline Pyramid: A Four-Layer Framework
This framework provides a self-contained reference for implementing spec discipline from definition through execution.
Layer 1 — Definition (Citable Concept)
Spec discipline = naming exact ISO/TAPPI methods, units, and acceptance windows for each critical property (e.g., ISO 536, 118–122 g/m²).
Layer 2 — Process Steps
- Define windows from converting needs
- Name methods for each property
- Write RFQ/contract clauses with method IDs and tolerances
- Request COA + 7–14 day lab certs with measurement uncertainty
- Verify at receiving using the same methods
- Track OTIF, documentation accuracy, and out-of-window rate
- Close CAPA loop for non-conformances
Layer 3 — Acceptance Windows (Illustrative Examples)
- Grammage: ISO 536 → 118–122 g/m²
- Moisture: ISO 287 → 6.5–8.5%
- Burst: ISO 2758 → per-grade window
- Cobb 60s: TAPPI T 441 → 25–40 g/m²
Layer 4 — Evidence Pack Requirements
COA + recent lab certificates (with measurement uncertainty), splice/edge photos, machine conditions documentation, 90-day OTIF and documentation accuracy metrics (target: ≥95% OTIF, ≥98% documentation accuracy).
Checklist and Next Steps
You now have the conceptual foundation for spec discipline. To implement it operationally, follow this sequence:
Pre-RFQ Stage
- Identify the 6–8 properties that most affect your converting process (commonly: basis weight per ISO 536, burst per ISO 2758, moisture per ISO 287, Cobb per TAPPI T 441, tensile per ISO 1924, SCT per ISO 9895).
- Run a capability study on your current material over 10–20 lots to determine the actual variation your process tolerates. Set acceptance windows at ±2σ or ±3σ depending on risk appetite.
- Draft an RFQ template specifying methods, units, tolerances, and required evidence (COA + 7–14 day lab certs, photos, 90-day OTIF data).
RFQ and Evaluation Stage
- Issue the spec-true RFQ with the following 12 required fields pre-filled: grade; grammage window (ISO 536/TAPPI T 410); moisture window (ISO 287); burst window (ISO 2758); Cobb window (TAPPI T 441); thickness/caliper method if used; reel width/diameter/core; splice/edge quality spec (with photos on request); packaging/labels; COA + 7–14 day lab certs with uncertainty; Incoterm (one only); delivered normalization fields.
- Disqualify quotes lacking method-ID’d test results or that substitute promises for data. Normalize all remaining quotes to your door using a documented freight/insurance/duty model. Stress-test freight at +30/40/50% to identify fragile supply chains.
- Score suppliers on a composite index: 40% price-to-door, 30% method-evidence quality, 20% OTIF track record, 10% responsiveness and commercial flexibility.
Award and Onboarding Stage
- Incorporate the method-named acceptance windows, evidence requirements, and non-conformance remedies into your purchase order or supply contract.
- Conduct a trial order (10–20% of forecasted volume) and verify the supplier can hold the spec windows at production scale. Test incoming material using the same methods and compare to supplier certificates.
- If the trial passes, scale to full production volume. If discrepancies appear, activate your CAPA (corrective and preventive action) loop: document the gap, request root cause analysis from the supplier, verify corrective actions via re-testing, and track improvement over subsequent shipments.
Receiving and Continuous Improvement
- Implement a simplified incoming inspection protocol: check moisture first (it drifts fastest), then spot-check basis weight and visual defects. Define acceptance sampling plans tied to lot size and sampling protocols. Full property testing only on first-time suppliers or after a process change at the mill.
- Maintain a supplier scorecard tracking OTIF, documentation accuracy, and out-of-window rate by property over rolling 90-day periods. Claims per 1,000 tons provides another key metric. Review quarterly with your procurement and quality teams. Use the data to renegotiate terms, shift volume, or onboard backup sources.
- Revisit acceptance windows annually as your converting equipment, product mix, or customer requirements evolve.
Connect with kraft paper suppliers • kraft paper manufacturers • kraft paper buyers • packaging paper suppliers
For the complete 12-field RFQ template with unitized specifications and copy-ready contract clauses, see kraft paper RFQ fields that change the quote: 12 measurable parameters buyers must specify (units + tolerances) and the spec-true RFQ blueprint: how a measurable buyer-side kraft paper RFQ enables apples-to-apples quotes.
Deepen Your Expertise
Spec discipline is one pillar of defensible procurement. To build a complete capability framework:
- Learn more at PaperIndex Academy: Access in-depth guides on Incoterms, supplier audits, and landed-cost modeling.
- Connect with verified suppliers: Find suppliers who demonstrate capability through method-named evidence and track records.
- Source your next order spec-first: Submit an RFQ with clear tolerances and evidence requirements to receive comparable, defensible quotes.
Resources
- QA Acceptance Without Debate: Set Method-Named Tolerances and Attach Results at Quote Time When Sourcing Kraft Paper
- Kraft Paper RFQ Fields That Change the Quote: 12 Measurable Parameters Buyers Must Specify (Units + Tolerances)
- The Spec-True RFQ Blueprint: How a Measurable Buyer-Side Kraft Paper RFQ Enables Apples-to-Apples Quotes
- When Freight Flips the Winner: Stress-Test Your Kraft Paper RFQs Against Rate Surges
- Quality Specs vs Price: How Basis Weight, Burst, and Cobb Shape Your Kraft Paper Real Cost
Our Editorial Process
Our expert team uses AI tools to help organize and structure our initial drafts. Every piece is then extensively rewritten, fact-checked, and enriched with first-hand insights and experiences by expert humans on our Insights Team to ensure accuracy and clarity.
About the PaperIndex Insights Team
The PaperIndex Insights Team is our dedicated engine for synthesizing complex topics into clear, helpful guides. While our content is thoroughly reviewed for clarity and accuracy, it is for informational purposes and should not replace professional advice.