

📌 Key Takeaways
Buyers who break their paper cup forecast into seven detail areas give suppliers enough structure to plan production, not just guess at scale.
- One Total Is Not Enough: A single annual cup number hides the product mix, seasonal peaks, and delivery details suppliers need to quote and plan.
- Break Volume by SKU: Each cup size and print style needs its own line, because a low-volume item might fall below one supplier’s minimum but work for another.
- Phase Demand Over Time: Separating consumption dates, order-release dates, and delivery dates prevents scheduling confusion and last-minute shortages.
- Label Your Confidence Level: Tagging each period or SKU as “early estimate,” “firmer,” or “ordered” tells suppliers which figures they can act on now.
- Turn the Forecast Into a Two-Way Tool: Asking suppliers to confirm their minimums, lead times, and capacity limits against your numbers starts a real planning conversation.
Detail turns a guess into a plan suppliers can actually use.
Foodservice buyers preparing their first supplier volume pack will find a ready-to-use information matrix and checklist in the guide below.
~ ~ ~ ~ ~ ~ ~ ~ ~ ~ ~ ~ ~ ~ ~ ~ ~ ~
A supplier-ready paper cup volume forecast covers seven information areas: product specifications, item-level quantities, consumption periods, expected order timing, delivery points, ordering models, and confidence levels. Its purpose is a focused supplier discussion, not false precision or an implied fixed order.
We expect to need one million paper cups next year” sounds useful, yet it answers only one of the seven.
Why One Annual Total Is Not Supplier-Ready
An annual total establishes approximate scale, but aggregation can conceal the structure of demand.
Consider an illustrative comparison drawn from common foodservice buying patterns. Two restaurant chains each forecast 1.2 million cups annually. Chain A runs three established sizes (8 oz, 12 oz, 16 oz) at roughly stable monthly volumes, orders monthly through a central warehouse, and uses an approved plain-white polyethylene-coated (PE-coated) cupstock already in production. Chain B concentrates 60 percent of its volume in two seasonal windows, carries a 4 oz espresso cup at only 40,000 units per year, and needs custom-printed artwork still awaiting approval. The supplier evaluating Chain B faces different questions: whether the 4 oz espresso cup clears a per-SKU production minimum (often around 50,000 cups, though this varies by supplier and format), how to schedule two seasonal peaks against other customers’ orders, and when artwork sign-off must occur relative to production lead time.
Thirty consumption sites could be supplied through one distribution center, several regional warehouses, or 30 direct ship-to-points — site count alone does not explain delivery structure.
The matrix below shows how a 1-million-cup annual forecast breaks down across SKUs, time phases, and ship-to locations.
Supplier Volume Information Matrix
| Information field | What the buyer should provide | Suggested format or label | Why it helps the supplier |
| Product reference | Cup size, format, use, and approved SKU or specification | SKU or specification ID | Keeps unlike products separate |
| Total planning volume | Expected quantity for the stated forecast horizon | Cups, cartons, or cases, with the unit basis | Establishes approximate scale |
| Size or SKU mix | Quantity or share for each item | Units and percentage | Shows the composition of demand |
| Time phasing | Demand by a consistent business period | Month, four-week period, or quarter | Reveals peaks and quieter periods |
| Opening order | Initial stock for launches or new locations | Separate line | Distinguishes launch stock from recurring demand |
| Replenishment cadence | Expected order-release pattern | Weekly, monthly, or event-based | Explains how the total may become orders |
| Locations covered | Consumption sites or location groups included | Site list or cohort | Defines forecast coverage |
| Delivery points | Warehouses or direct-to-site destinations | Ship-to list | Describes the physical delivery structure |
| Forecast status | Relative planning status by period or SKU | Early estimate, indicative, firmer, or ordered | Signals how the figure should be interpreted |
| Range | Alternative estimates where uncertainty is material | Low, base, and high | Avoids unsupported precision |
| Assumptions | Openings, promotions, operating days, or substitutions | Short notes | Explains what drives the figures |
| Exclusions | Products, markets, or sites not covered | Explicit list | Prevents accidental overinterpretation |
| Update details | Owner, version, issue date, and next review | Version block using YYYY-MM-DD dates | Supports controlled revisions |
| Supplier questions | Minimum order quantity (MOQ), packaging, timing, and production constraints to confirm | Open-item column | Turns the file into a two-way discussion |
The matrix is a planning framework, not a universal form. Provide only the granularity needed to explain the requirement.
Identify the Cup Sizes, SKUs, and Specifications Behind the Volume
Place each approved SKU or coherent specification family on a separate line. Include size, intended use, relevant construction format, print status, and a stable specification reference. Show units and mix percentage where useful.
A high annual total can still contain a low-volume specialty SKU that requires separate review. A 4 oz espresso cup at 40,000 units per year may sit below one supplier’s minimum run of 50,000 cups per production setup, yet another supplier using narrower paper reels or smaller cup-forming machines may accommodate it. Similarly, a printed cup may carry a higher per-SKU MOQ than its plain equivalent because the supplier needs to recover printing-plate costs and set-up time across the run. Packaging configuration adds another variable: a supplier quoting in cases of 1,000 may require full-case multiples, which changes the effective minimum for each release. These thresholds are supplier- and product-specific — confirm them for each SKU rather than assuming a low-volume item automatically fails.
Keep product approval status visible. An established plain cup should not appear identical to a printed format whose artwork or sample remains under review. Label unresolved items rather than attaching volume to an apparently final specification.
Reference technical requirements rather than reproducing them. A separate paper cup material specification can hold the detailed product fields. Where cup performance still needs to be converted into buying language, the guide to supplier-ready cupstock specifications provides a related framework.
With specification, quantity, and approval status recorded per SKU, the next step is phasing demand across time periods.
Separate Consumption, Order-Release, and Delivery Timing
Use a time period that matches the buyer’s planning process, such as months, four-week periods, or quarters. No interval suits every business.
Separate recurring demand from openings, promotions, menu changes, seasonal activity, closures, and product transitions. Name the event and affected SKU.
Three dates should remain distinct:
- Consumption date: when locations are expected to use the cups.
- Order-release date: when procurement or an authorized site expects to issue the purchase order.
- Requested delivery date: when inventory needs to arrive at the relevant ship-to point.
These dates may differ. In an illustrative opening scenario, stock may need to arrive before service begins, while order release depends on artwork approval and the launch schedule. Each supplier must confirm its applicable lead-time components.
Show anticipated order cadence as an assumption when unsettled. Monthly consumption could become monthly releases, larger periodic orders, or many local orders. Broader guidance from
ASCM’s overview of sales and operations planning also treats demand and supply planning as cross-functional work involving operational and financial inputs, reinforcing the need for one internally aligned forecast before supplier communication.
Map Locations, Delivery Points, and Ordering Responsibility

Distinguish the consumption site, ordering entity, invoice entity, and ship-to point; they are not necessarily the same.
Explain whether purchasing is centralized, centrally negotiated but locally ordered, locally managed, or routed through a distributor. A network forecast may still produce many local order releases.
Use site-level forecasts only when they change allocation, timing, or delivery interpretation. Otherwise, group similar locations. Keep openings, closures, and phased rollouts separate.
Organizations using standardized identifiers may reference them. GS1’s Global Location Number (GLN) standard can identify companies, functions, and physical or digital locations, but a GLN is optional — a clear internal delivery-point code may be sufficient. GS1’s GLN guidance provides the formal standard.
Mapping delivery points resolves where stock must arrive, but a forecast becomes more useful when the supplier also understands how confident each figure is. Buyers who label uncertainty by period or SKU — rather than applying a single caveat to the entire file — give suppliers a clearer basis for production and capacity planning.
Label Uncertainty by Period or SKU
In practice, a forecast with clearly labeled uncertainty is more useful to a supplier than one that presents every figure at the same apparent confidence level. A range tied to stated assumptions can be more informative than unsupported precision.
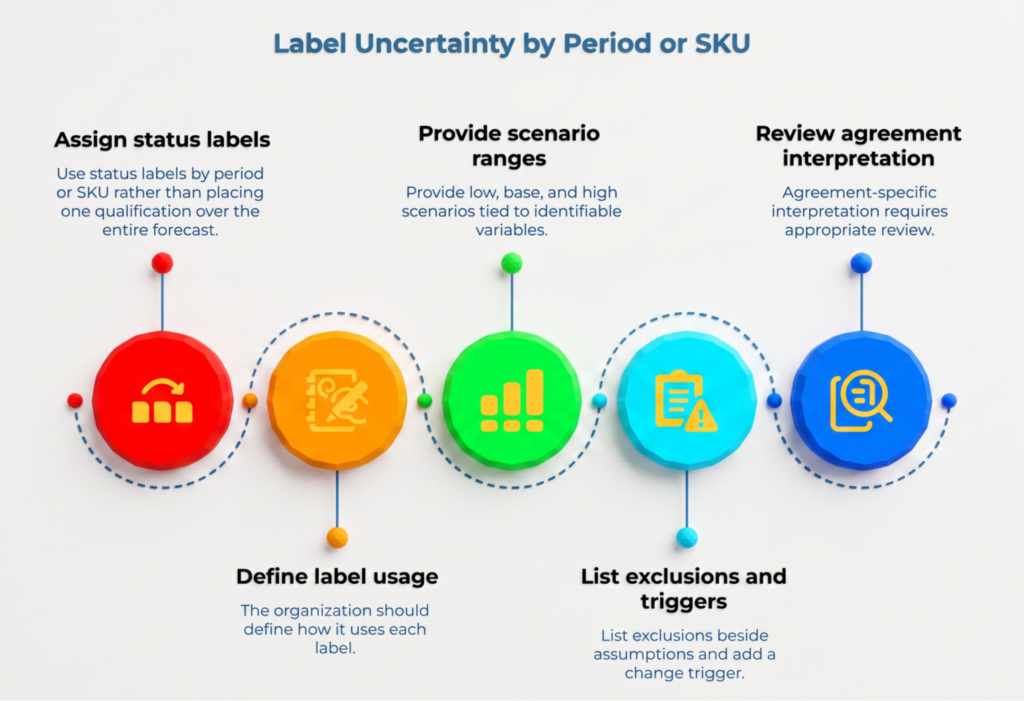
Use status labels by period or SKU rather than placing one qualification over the entire forecast. Suitable neutral labels may include early estimate, indicative planning volume, base forecast, firmer planning figure, and purchase order issued. The organization should define how it uses each label. Terms such as “firm,” “committed,” or “binding” should not be assigned a universal legal meaning.
Where uncertainty is material, provide low, base, and high scenarios tied to identifiable variables, such as opening dates, promotion participation, menu availability, or product substitution. Avoid arbitrary tolerance percentages.
List exclusions beside assumptions. Then add a change trigger, such as promotion approval, an opening delay, a specification change, or a material difference between forecast and actual usage. The commercial or legal effect of the forecast depends on the parties’ communications, purchase documents, and agreement; agreement-specific interpretation requires appropriate review.
Ask Suppliers to Translate the Forecast Into Their Constraints
Ask each supplier to confirm SKU-level MOQ or production minimum, packaging configuration, approval steps, lead-time components, and preferred forecast granularity.
Also ask which products or periods raise capacity questions, when artwork or samples must be confirmed, and how revisions should be communicated. Supplier documentation applies only to that supplier’s current conditions.
An early forecast does not guarantee capacity, priority, availability, or pricing. Its value is that it gives the supplier a consistent basis for explaining what can be assessed, what depends on clarification, and what must wait for a purchase order or separate agreement.
Control Versions and Communicate Changes
Every shared file should identify its owner, version, issue date, period covered, next review date, and superseded version.
Define update triggers such as an opening delay, menu change, promotion approval, specification revision, usage variance, or confirmed packaging constraint. Send revisions through one agreed channel and summarize the changes.
One clearly owned file, a consistent naming convention, and an agreed review process can provide workable control.
Before Sending the Forecast
- Are quantities separated by cup size or SKU?
- Is demand phased over time?
- Are opening and replenishment orders separated?
- Are consumption sites and delivery points clearly distinguished?
- Are assumptions, exclusions, ranges, and status labels visible?
- Does the file show its owner, version, issue date, and next review date?
- Are supplier-specific questions listed?
Frequently Asked Questions
Is Annual Paper Cup Volume Enough for an Early Supplier Discussion?
It may be enough to establish an approximate scale. It often needs supporting detail when product mix, timing, delivery structure, order cadence, or uncertainty affects how the requirement must be evaluated.
Should Buyers Share Volume by Location?
Share location-level detail when it changes delivery, allocation, or demand interpretation. When individual data is unnecessary or sensitive, group locations with similar demand or delivery characteristics.
Does Sharing a Forecast Commit the Buyer to Order That Volume?
There is no universal answer. Its status depends on the parties’ communications, purchase documents, and agreement. Planning figures should be labeled clearly, and commitment-related wording should receive appropriate review.
What Should Buyers Do When the Forecast Is Highly Uncertain?
Use low, base, and high estimates where useful, state the assumptions behind them, distinguish more stable periods from less stable ones, and specify the next review date and change triggers.
Share Enough Detail to Make the Forecast Usable
A supplier-ready forecast connects product identity, quantity, timing, delivery structure, order-release method, and uncertainty. It should show what is known, assumed, excluded, and subject to change.
Before contacting suppliers, organize cup sizes, period volumes, delivery points, assumptions, and forecast status in one dated information pack. Once the requirement is documented, explore paper cup manufacturers and compare how each supplier responds to the same volume assumptions.
Disclaimer:
This article is for general informational purposes only. It is not a substitute for advice from a qualified professional, provider, or official source relevant to your situation. Always verify important decisions with the appropriate expert, authority, or service provider.
Our Editorial Process:
Our expert team uses AI tools to help organize and structure our initial drafts. Every piece is then extensively rewritten, fact-checked, and enriched with first-hand insights and experiences by expert humans on our Insights Team to ensure accuracy and clarity.
About the PaperIndex Insights Team:
The PaperIndex Insights Team is our dedicated engine for synthesizing complex topics into clear, helpful guides. While our content is thoroughly reviewed for clarity and accuracy, it is for informational purposes and should not replace professional advice.