
📌 Key Takeaways
Kraft paper price volatility doesn’t have to mean budget chaos—systematic guardrails turn market noise into manageable corridors.
- Budget Bands Replace Negotiation Firefights: Pre-agreed pricing corridors (typically ±5-8% around normalized baselines) define what gets auto-approved versus what triggers structured escalation, eliminating the internal tug-of-war between procurement and finance every time a supplier signals an increase.
- Partial Index Linkage Hedges Drift Without Surrendering Control: Connecting 30-40% of volume to a neutral pulp benchmark—with documented lag and methodology—allows automatic, transparent price adjustments while keeping the majority of spend locked or opportunistic, reducing renegotiation cycles without creating budget unpredictability.
- Four Signals Beat Hundreds of Variables: Pulp benchmarks, energy surcharges, freight rates, and FX exposure account for 90% of meaningful kraft paper cost movement; weekly threshold checks on these four drivers catch surprises before they hit the P&L and keep stakeholders aligned on the same facts.
- To-Door Normalization Prevents False Winners: Converting every quote—EXW, FOB, CIF, DDP—to a single landed-cost basis exposes hidden freight exposure and energy pass-throughs that can flip supplier rankings by 15-25% once fully loaded, making comparison honest and freight surges manageable rather than catastrophic.
- 15-Minute Monday Cadence Replaces Ad-Hoc Panic: A lightweight weekly review (check signals, confirm band status, log actions) creates accountability without bureaucracy; when everything’s Green the meeting takes five minutes, and when a Red trigger hits, everyone already knows the escalation protocol.
Prepared bands, documented thresholds, and disciplined cadence deliver predictable margins and faster approvals with less internal friction.
Procurement and sourcing managers at SMB packaging converters will find a practical implementation framework here, preparing them for the detailed operational guidance that follows.
Price chaos hits differently when you’re the one who has to explain it.
A mid-sized converter receives three quotes for the same kraft paper grade. One supplier cites pulp spikes. Another blames freight surcharges. The third offers a “market-adjusted” price with no explanation. Finance needs a decision by end-of-day, but the quotes aren’t even comparable—one’s EXW, another’s CIF, and the third includes energy pass-throughs buried in fine print.
This isn’t a procurement problem. It’s a budget-stability problem. Without a systematic approach to managing kraft paper volatility, every supplier conversation becomes a negotiation from scratch, every price increase triggers internal fire-drills, and quarterly forecasts turn into guesswork.
The solution isn’t to eliminate volatility—that’s impossible. The solution is to convert price noise into pre-agreed quoting corridors, governed by simple scenarios and anchored to a neutral benchmark. Think of it as guardrails on a winding road. The road still twists, but you stay in-lane.
This playbook provides a step-by-step framework for procurement and sourcing managers at SMB packaging converters to build a practical budget-stability system. The framework uses three levers: 90-day budget bands that define acceptable price ranges, partial index linkage that anchors a share of volume to neutral benchmarks, and a weekly governance cadence that aligns owners, procurement, and operations around the same four signals.
The Converter Budget-Stability System: What It Is and Why It Works
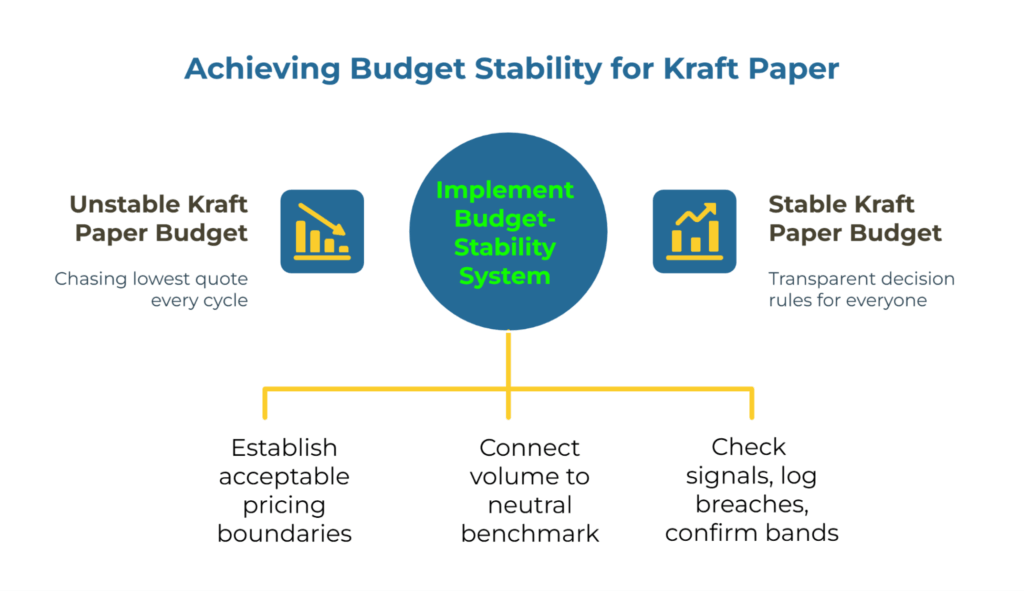
Budget management for kraft paper means establishing defensible quoting corridors rather than chasing the lowest quote every cycle. The system rests on three interconnected levers working together.
First, 90-day budget bands establish the upper and lower boundaries for acceptable pricing. These bands aren’t arbitrary—they’re built from normalized historical quotes, adjusted for known cost drivers, and stress-tested against realistic scenarios. The bands give procurement a clear mandate: prices within the corridor get approved through normal channels; prices outside trigger a structured escalation and review.
Second, partial index linkage connects a defined share of your volume to a reputable, neutral pulp benchmark. This doesn’t mean you surrender pricing control to an index. It means you pre-agree with finance and suppliers that a portion of your contracts will adjust automatically when specific thresholds are crossed, eliminating the need to renegotiate from zero every time the pulp moves.
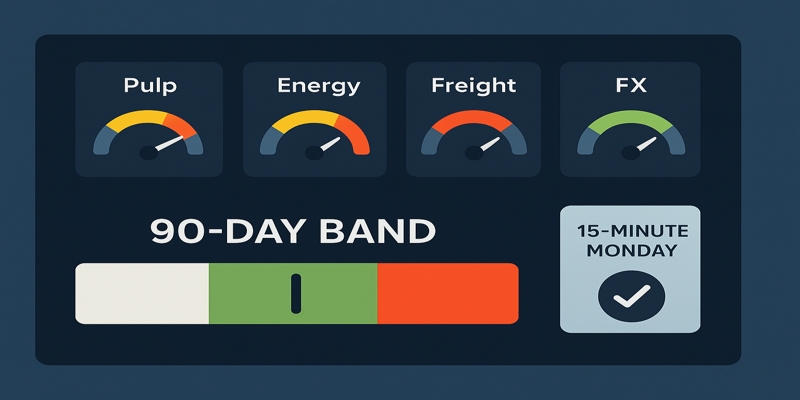
Third, weekly governance rhythm ensures the system stays current without becoming a burden. A 15-minute Monday review checks the four signals that matter (pulp benchmarks, energy surcharges, freight variables, FX exposure), logs any threshold breaches, and confirms whether your bands remain valid or need adjustment.
The beauty of this approach is its simplicity. You’re not building a complex forecasting model or hiring a market-intelligence service. You’re creating transparent decision rules that everyone—from the owner to the warehouse manager—can understand and trust. The business impact shows up as fewer price disputes, faster approvals from finance, and steadier contribution margins quarter over quarter.
Build 90-Day Budget Bands in 30 Minutes
The foundation of budget stability is having a rational starting point. Budget bands work because they define “normal” in advance, which makes exceptions obvious and defensible. Here’s the four-step setup.
Normalize to “To-Door” First
The most common mistake in kraft paper procurement is comparing quotes that aren’t actually comparable. When one supplier quotes EXW Shanghai, another quotes CIF Los Angeles, and a third quotes DDP to your warehouse, you’re looking at three completely different cost structures.
Normalization means converting every quote to the same delivery basis—typically to your receiving dock—and documenting all assumptions in a shared spreadsheet. Map freight costs by lane and mode. Add insurance where needed. Include customs duties and local handling. The goal is a single number per supplier that represents true landed cost.
This step alone prevents the majority of budget surprises. Freight surcharges that seem invisible in a CIF quote become explicit line items. Energy pass-throughs get separated from base price. Currency exposure gets quantified rather than assumed away.
For a detailed method on achieving to-door comparability of kraft paper across mixed Incoterms, refer to our normalization guide. You can also learn how to normalize EXW/CIF/DDP for true comparisons using a practical step-by-step framework. The ICC’s official Incoterms guide provides a visual reference to help teams stay consistent on cost allocation and risk transfer when mapping quotes to a common delivery basis.
Pick the Reference Index and Document Lag
Choosing a pulp benchmark isn’t about finding the “right” index—it’s about selecting a reputable one that covers your grade and geography, then documenting its methodology and timing lag so everyone understands what they’re agreeing to.
Established indices from organizations like Fastmarkets RISI or PPPC track pulp prices with transparent methodologies. Before adopting any benchmark, review its methodology page to understand how data is collected, what transaction types are included, and how frequently prices are updated. Fastmarkets, for example, publishes detailed methodology overviews that explain scope, coverage, and publication timing for each index they maintain.
The key is understanding that indices are reporting tools, not predictive models. They reflect market transactions that have already occurred, which means there’s always a lag between the index publication date and the transactions it represents.
Document this lag explicitly in your cadence sheet. If your chosen index publishes monthly data with a two-week collection period, prices you see in early April reflect late-March transactions. This lag isn’t an error—it’s a feature that provides stability. It prevents daily whiplash and gives both sides time to validate whether a reported move is sustained or temporary.
Set Band Width and Triggers
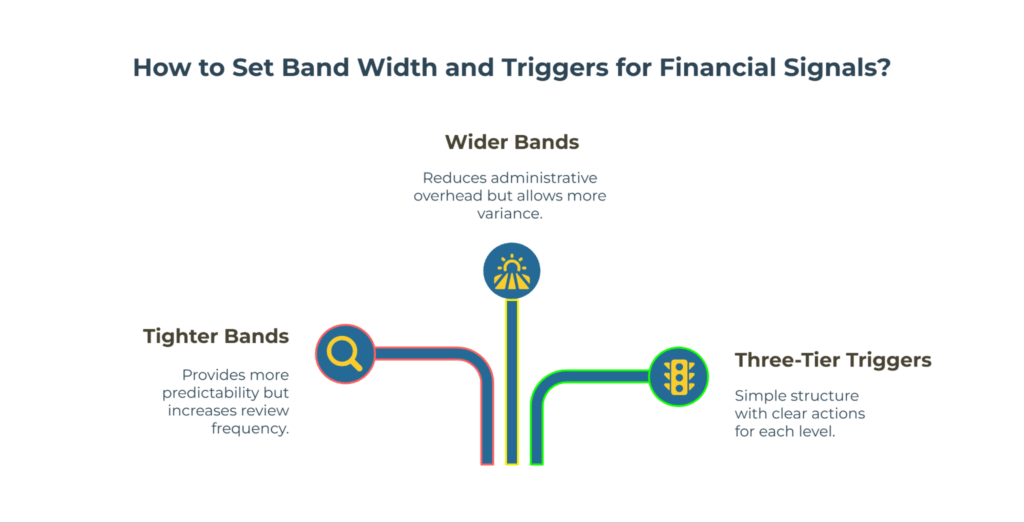
Band width depends on your risk tolerance and margin structure, but a pragmatic starting point is ±5-8% around your normalized baseline from the previous quarter. Tighter bands give finance more predictability but increase the frequency of reviews. Wider bands reduce administrative overhead but allow more variance.
The triggers define what happens when signals move beyond your bands. A simple three-tier structure works well: Green (within bands, no action), Yellow (approaching threshold, flag for Monday review), Red (breach confirmed, escalates to structured re-link discussion).
Threshold math uses the Four Signals framework described in the next section. If your pulp benchmark moves +7% and your band width is ±6%, you’re in Yellow territory. If it crosses +10% and stays there for two consecutive weeks, you’re Red.
Allocate Volume: Fixed vs. Index-Linked vs. Spot
Pure fixed-price contracts maximize predictability but leave you exposed when markets move sharply in your favor. Pure index-linked contracts maximize flexibility but can create budget variance that finance struggles to explain. Pure spot buying gives ultimate agility but introduces supply-chain risk during tight markets.
A blended approach balances these trade-offs. Allocate 50-60% of volume to fixed-price term contracts that lock in baseline supply and satisfy finance’s need for forecast confidence. Link 30-40% to your chosen index with pre-agreed adjustment formulas, allowing some automatic correction without constant renegotiation. Reserve 10-20% for spot purchases, giving you room to take advantage of temporary market dislocations or fill unexpected demand spikes.
The exact percentages should reflect your specific margin structure, customer contract terms, and working capital constraints. A converter with firm customer commitments and thin margins skews toward more fixed volume. A converter with flexible customer arrangements and stronger margins can carry more index exposure.
The Four Signals That Matter (and How to Threshold)
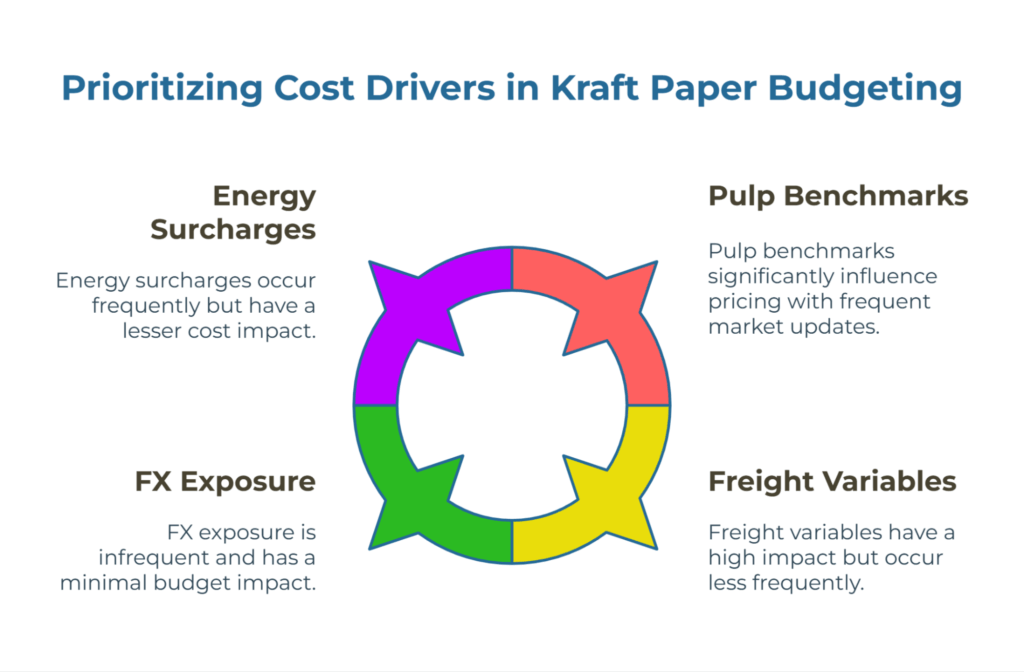
Budget bands only work if you’re monitoring the right inputs. The kraft paper cost stack has hundreds of variables, but four signals drive the majority of meaningful price movement. Track these weekly, set clear thresholds for each, and you’ll catch 90% of the surprises before they hit your P&L.
Pulp Benchmarks
Northern Bleached Softwood Kraft (NBSK) pulp is the most widely tracked benchmark and influences pricing for virgin kraft grades across regions. If you’re sourcing recycled-content kraft, track relevant recovered-fiber indices instead. The principle is the same: identify the commodity input that represents the largest share of your supplier’s cost structure, then monitor its published benchmark.
Set your threshold at ±5-7% movement sustained over two weeks. Single-week spikes often reverse and don’t require action. Two consecutive weeks above threshold triggers your Yellow alert for Monday review. Three weeks triggers Red and escalates to a structured conversation with suppliers about potential re-links or contract adjustments.
Regional differences matter. European suppliers may reference different pulp grades than North American or Asian producers. Confirm which specific benchmark your suppliers use and track that one, not a generic global index.
Energy Surcharges
Energy costs—particularly natural gas and electricity—represent the second-largest variable input for most kraft paper mills. Many suppliers now include explicit energy surcharge clauses in contracts, but the formulas vary widely.
Translate any energy surcharge into a per-ton impact on your landed cost. If a supplier’s contract says “€5 per MWh increase translates to €X per ton,” calculate what that means for your to-door cost after freight and duties. This normalization lets you compare energy exposure across suppliers who use different surcharge mechanisms.
Buffer reasonable energy variance inside your bands. If historical data shows energy typically swings ±10% quarter-over-quarter, build that into your baseline assumption rather than treating every small move as a discrete event requiring action.
Freight Variables
Freight can flip supplier rankings faster than any other variable, particularly on long-haul ocean routes where fuel surcharges, port congestion, and equipment shortages compound. The mistake isn’t tracking freight—it’s tracking it in isolation from your bands.
Normalize freight into your to-door model from the start, but flag it as a separate line item so you can see when it’s the driver of variance. If your band breach is caused by a freight spike rather than base-price or pulp movement, your response is different—you might switch suppliers, change shipping modes, or renegotiate freight terms rather than reworking the entire contract.
Use scenario testing to understand your exposure before it hits. For guidance on how to stress-test freight scenarios and understand when ocean rate changes alter supplier rankings, review our RFQ stress-testing framework.
FX Exposure
If you’re sourcing internationally, currency moves can erase margin faster than any paper-market dynamic. The threshold depends on your hedge strategy and contract currency, but ±3-5% sustained FX movement typically warrants a band review.
Document which currency each supplier quotes in and calculate your net exposure across the portfolio. If 70% of your volume is quoted in EUR and your sales are in USD, a 5% EUR strengthening against the dollar has a material, calculable impact on your landed costs. Build simple thresholds into your Monday review: if EUR/USD crosses a predetermined level and holds for two weeks, Yellow flag. If it crosses a second threshold, Red flag and discuss with finance whether to adjust bands or implement currency hedging.
Scenario Play: Three Simple What-Ifs to Protect 2-3% Margin
Budget bands aren’t static. They need to survive realistic stress without constant rework. Before finalizing your bands, run three common scenarios to verify your system holds up under pressure.
Scenario 1: Pulp +10%, Freight Neutral
Your reference pulp index jumps 10% over four weeks and stabilizes. Energy and freight remain within normal ranges. Your index-linked portion (30-40% of volume) auto-adjusts per formula. Your fixed portion (50-60%) holds at contracted price. Result: blended landed cost increases approximately 3-4%. Question: Does this breach your band? If yes, does your escalation process lead to a rational re-link discussion, or does it trigger panic? If the answer is panic, widen your bands slightly or increase your index-linked share.
Scenario 2: Pulp Neutral, Freight +30%
A port strike or equipment shortage drives ocean freight up sharply on your primary supply lane. Pulp and energy remain stable. Your to-door costs increase 8-12% depending on freight’s share of landed cost (typically 20-35% for intercontinental moves). Result: This likely breaches even wide bands. But because your normalization model identifies freight as the driver, your response is tactical—explore alternative routings, negotiate temporary surcharges with customers, or shift volume to a domestic supplier—rather than strategic renegotiation of base paper pricing.
Scenario 3: FX Erosion +5%, Pulp Stable
Your functional currency weakens 5% against your primary supplier’s currency over eight weeks. Pulp and freight remain normal, but your per-ton cost in local currency increases by the FX movement. Result: This typically breaches bands but with a different remedy. Finance evaluates whether to accept the variance (if customer pricing includes FX pass-through), implement a forward contract to lock the rate, or shift volume to a supplier quoting in your home currency.
These three scenarios represent the most common band-breach patterns SMB converters face. By pre-planning responses, you convert surprises into structured decisions.
Contracting Mix: When to Go Fixed, Indexed, or Spot (and How Much)
The allocation between fixed-price, index-linked, and spot contracts isn’t a one-time decision—it should flex based on market conditions and your confidence in the outlook. But a stable baseline allocation provides predictability while preserving flexibility.
Fixed-price contracts work best when you have high conviction that markets are at or near a peak, or when your own customer contracts lock you into firm pricing for an extended period. The risk is being locked in when markets fall. The benefit is eliminating budget variance and simplifying internal approvals.
Index-linked contracts shine during periods of high volatility when neither you nor your suppliers have conviction about direction. The agreed formula removes negotiation friction and keeps the commercial relationship focused on service, quality, and delivery rather than monthly price debates. The risk is potential budget variance if the index moves more than finance modeled. The benefit is automatic correction that prevents you from being either significantly overpaying or creating supplier margin pressure that degrades service.
Spot buying serves as a release valve. It lets you take advantage of temporary market dislocations, test new suppliers without long-term commitment, or cover unexpected demand without renegotiating existing contracts. The risk is supply availability during tight markets. The benefit is maximum pricing agility and competitive tension.
A 50-30-20 split (fixed-indexed-spot) provides a pragmatic starting point for most SMB converters. Adjust the ratio quarterly based on market outlook, margin pressure, and working capital availability.
Operational Reality: MOQ and Minimum-Run Constraints Don’t Care About Your Model
Budget bands and index formulas feel elegant on spreadsheets, but they crash into manufacturing reality fast. Suppliers have minimum order quantities and minimum production-run requirements that directly impact your ability to execute a blended contracting strategy.
If your “optimal” allocation calls for ordering small quantities from multiple suppliers, but each maintains a 40-ton MOQ, your actual cash outlay and inventory carrying costs diverge significantly from your model. This variance doesn’t invalidate the band concept—it means you need to fold working capital impact into your governance cadence.
The Monday review should track not just whether prices are in-band, but whether your planned volume allocation is executable given current supplier lead times and MOQ constraints. If a preferred supplier extends lead times from four weeks to eight, that might force you to increase spot share temporarily to maintain buffer stock, which then increases cash-use variance even if per-ton pricing stays in-band.
Document these operational constraints explicitly in your assumption log. When finance asks why Q2 spending ran 6% over forecast despite prices staying in-band, you want a clear answer: “We shifted 12% more volume to spot market due to extended MOQ requirements from Supplier A, resulting in higher per-unit cash outlay and increased safety stock.”
Freight Can Flip the Winner (Don’t Let It)
Freight deserves its own attention because it’s the variable most likely to reverse your supplier rankings mid-contract without any change in paper pricing. A supplier quoting the lowest FOB price can become the most expensive delivered option when ocean rates spike 40% or port congestion adds two weeks to transit time.
The solution isn’t avoiding freight risk—it’s stress-testing it upfront and building clear contingency triggers. When evaluating quotes, don’t just normalize to current freight rates. Model what happens if rates increase 20%, 30%, and 50%. Identify the inflection point where Supplier B becomes cheaper than Supplier A delivered to your door.
Build these inflection points into your Monday review as explicit triggers. If Pacific freight rates cross $X per container, Supplier B moves from backup to primary for the next order cycle. If Atlantic rates fall below $Y, Supplier A regains priority. This decisioning framework removes emotion and politics from freight-driven supplier switches.
Freight transparency also matters in supplier relationships. If you’re working with an exporter or trading company rather than a direct mill, clarify who controls freight booking and whether you can use your own forwarder. Buyer-nominated logistics often gives you better rate visibility and more control over transit timing, but it also shifts responsibility for freight-rate variance from the supplier to your budget.
Governance: The Weekly Rhythm That Aligns Owners, Procurement, and Operations
Budget bands fail without disciplined governance. The difference between a system that works and a spreadsheet that collects dust is a 15-minute weekly discipline that keeps everyone aligned on the same facts.
The Monday review has a simple agenda. Check the four signals against thresholds. Log any Yellow or Red flags. Confirm band status. Assign follow-up actions if needed. This structured weekly review is designed to be highly efficient, replacing ad-hoc debates with a focused 15-minute check-in on key signals.
The review shouldn’t require elaborate preparation. Your threshold tracking happens in a simple spreadsheet with one row per signal, current value, threshold, and status (Green/Yellow/Red). Update it Monday morning before the call. If everything’s Green, the meeting is five minutes: “All signals in-range, bands holding, next review in seven days.”
When a signal goes Yellow or Red, the review expands but stays structured. Yellow means “flag for awareness”—note it, discuss briefly whether it’s likely to reverse or accelerate, decide if any proactive communication with suppliers or customers is warranted. Red means “escalate per protocol”—convene the decision-makers (typically owner, finance, procurement lead, operations manager) for a structured discussion using the pre-agreed escalation checklist.
The cadence creates accountability without bureaucracy. Procurement isn’t making unilateral decisions. Operations aren’t surprised by price adjustments. Finance isn’t reacting to variances after the fact. Everyone sees the same dashboard weekly and knows the decision rules in advance.
Copy-Ready Internal Email Template
Subject: Kraft Paper Budget Bands & Weekly Cadence — Q[n]
To: [Owner], [Finance Lead], [Procurement Lead], [Operations Manager]
Signal Status This Week:
• Pulp Benchmark (NBSK): [Current value] vs Threshold [±X%] → [Green/Yellow/Red]
• Energy Surcharge: [Current value] vs Threshold [±X%] → [Green/Yellow/Red]
• Freight (Primary Lane): [Current rate] vs Threshold [±X%] → [Green/Yellow/Red]
• FX (EUR/USD or relevant pair): [Current rate] vs Threshold [±X%] → [Green/Yellow/Red]
Band Status: [Within corridor / Approaching threshold / Breached]
Bands: [Current corridor] based on last quarter’s landed average; methodology and assumptions logged in the shared folder.
Index-Linked Share: [X%]; re-link triggers at [specified conditions].
Actions Required:
[If all Green: “No action required. Bands remain valid through [Date]. Next review [Date].”]
[If Yellow: “Flag for monitoring: [Specific signal] approaching threshold. Review again next week for sustained movement.”]
[If Red: “Escalation triggered: [Specific signal] breached threshold for [X] consecutive weeks. Convene re-link discussion per protocol. Action owner: [Name]. Deadline: [Date].”]
Assumption Log Updates: [Any changes to freight lanes, supplier lead times, MOQ constraints, or FX exposure]
Next Review: [Date/Time]
Deep Dive: Understanding Budget Bands and Index Linkage
Budget bands and index linkage often get confused with forecasting or market-data subscriptions. They’re neither. Understanding what they actually do—and what they don’t—prevents misaligned expectations and builds internal confidence in the system.
Why It’s Critical
Budget bands establish shared decision-authority between procurement and finance. Without bands, every supplier price change becomes a negotiation between departments. Procurement argues the increase is justified by market conditions. Finance argues procurement should have negotiated harder. The band removes this friction by pre-defining “normal” variance that gets approved automatically and “exceptional” variance that triggers structured escalation.
Index linkage creates transparency in pricing adjustments. When a portion of your contracts auto-adjust based on a neutral benchmark, both sides can verify the math. There’s no debate about whether a supplier’s increase is reasonable—it either matches the agreed formula or it doesn’t. This reduces renegotiation time and preserves the commercial relationship for issues that actually matter: quality, delivery performance, technical support.
Together, bands and linkage deliver budget credibility. Finance can forecast with confidence because variance is bounded and governed. Suppliers can plan production because volume commitments are stable even when pricing adjusts. Operations can schedule without disruption because procurement isn’t constantly switching suppliers to chase marginal cost savings.
Common Misconceptions
Misconception 1: Index-linked means we lose control over pricing.
Reality: You’re exchanging one type of control (negotiating every price move) for another (pre-agreeing on the adjustment mechanism). The total cost over time often ends up similar, but the administrative burden drops dramatically and budget variance becomes predictable rather than surprising.
Misconception 2: Lag in index reporting makes it inaccurate.
Reality: Lag isn’t an error—it’s a feature that prevents daily overreaction. The index reflects actual transaction prices from recent weeks, not spot-market speculation. This lag means adjustments are based on sustained market moves, not temporary spikes that reverse before they impact your supplier’s actual costs.
Misconception 3: We need expensive market-intelligence services to make this work.
Reality: Publicly available benchmarks from reputable sources provide sufficient data for band management. You’re not trying to predict the market or trade futures—you’re creating a rational adjustment mechanism using widely accepted reference points. The system works with free or low-cost index data that major forestry publications and industry associations already track.
Real-World Implications
Budget bands change how internal approvals flow. Purchase orders within bands get approved automatically through normal channels—often same-day if the supplier quote matches the logged baseline. Purchase orders outside bands trigger a structured escalation, but because everyone already knows the thresholds and the escalation protocol, the discussion is faster and more focused.
Index linkage changes how supplier relationships operate. Quarterly business reviews shift from adversarial price negotiations to collaborative discussions about quality improvements, lead-time optimization, and service enhancements. The pricing mechanism is already agreed, so the relationship can focus on operational excellence.
Predictable margins change how you approach customer contracts. If your kraft paper cost variance is bounded within ±5-8%, you can confidently commit to customer pricing for longer periods, reducing your own sales friction and potentially commanding better terms. Some converters pass the band structure through to customers—”our pricing adjusts quarterly within defined corridors based on pulp benchmarks”—creating alignment up and down the value chain.
Consensus Kit: Building Internal Buy-In for the Blended Approach
The biggest barrier to implementing a budget-stability system isn’t technical complexity—it’s getting everyone in the room to agree. Owners want cost control. Finance wants forecast accuracy. Procurement wants negotiating flexibility. Operations want supply continuity. A blended contracting approach serves all four, but you need to show them the trade-offs explicitly.
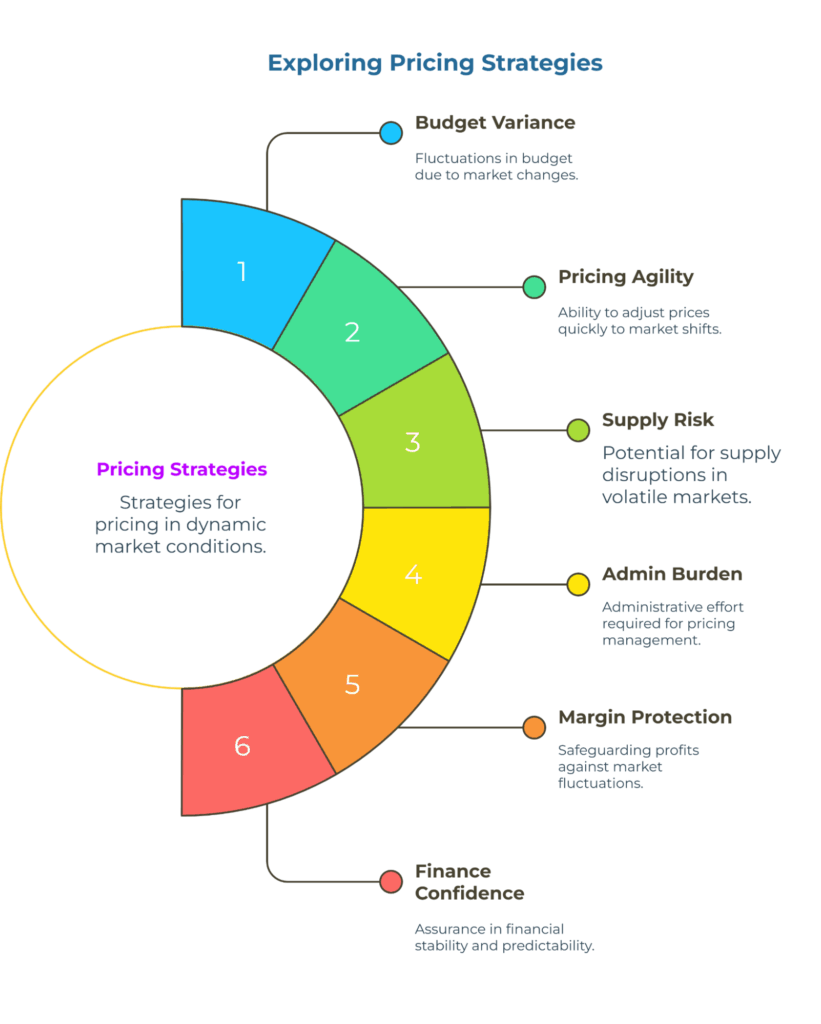
Comparison: Spot-Only vs. Fixed-Only vs. Blended
| Dimension | 100% Spot | 100% Fixed | Blended (50-30-20) |
| Budget Variance | High (can swing ±15-25%) | Zero (locked for contract term) | Moderate (bounded ±5-10%) |
| Pricing Agility | Maximum (respond to market in real-time) | Zero (locked in regardless of market) | Moderate (index-linked portion auto-adjusts) |
| Supply Risk | High (no guaranteed volume in tight markets) | Low (volume committed) | Low (core volume committed via fixed + indexed) |
| Admin Burden | Very High (constant RFQ cycles & negotiations) | Low (negotiate once per term) | Low (weekly review, minimal renegotiation) |
| Margin Protection | Excellent in falling markets, Poor in rising markets | Excellent in rising markets, Poor in falling markets | Balanced across market cycles |
| Finance Confidence | Low (unpredictable cash outlay) | High (locked cash outlay) | High (variance bounded, mechanisms transparent) |
| Best Used When | High working capital, sophisticated trading desk, volatile markets | Strong conviction markets peaked, customer pricing locked | Most common scenario: need predictability + flexibility |
Risk-Mitigation Checklist
Before presenting the blended approach internally, prepare these four work products to demonstrate diligence:
1. Index Selection Documentation
Choose your reference index and document: (a) publisher and reputation (e.g., Fastmarkets, PPPC), (b) methodology summary (how prices are collected and averaged), (c) publication frequency and lag (weekly/monthly, collection period), (d) geographic and grade coverage (does it match your sourcing profile?), (e) historical volatility (±X% range over past 12-24 months).
2. Assumption Log
Create a shared spreadsheet tracking: (a) baseline to-door cost by supplier (normalized), (b) freight assumptions by lane and mode, (c) energy and FX assumptions, (d) MOQ and lead-time constraints, (e) contract term and renewal dates, (f) last updated date and change log.
3. To-Door Normalization Model
Build a simple calculator that converts any Incoterm quote (EXW, FOB, CIF, DDP) to consistent landed cost at your warehouse. Include line items for: base price, freight by mode, insurance, duties, local handling, energy surcharges. This model gets used in every RFQ evaluation and Monday review.
4. Escalation Protocol
Write down the decision tree for band breaches: (a) Green status = no action, (b) Yellow status = flag at Monday review + monitor, (c) Red status = convene stakeholders within 48 hours using pre-agreed agenda: verify breach, assess cause (pulp/freight/FX/supplier-specific), evaluate options (accept variance, renegotiate, switch supplier, adjust bands), document decision and rationale.
Present these four work products together and the conversation shifts from “should we try this?” to “how fast can we implement?”
Value Summary: The Business Case for Budget Stability
The budget-stability system delivers three core business benefits that show up in different parts of the organization but compound to material bottom-line impact.
Predictable Margin Corridors
Finance can forecast kraft paper spend with confidence because variance is bounded and governed. Instead of explaining surprise overruns or defending conservative buffers that go unused, the CFO can commit to a spend range (e.g., $1.2M ±6%) knowing the band system will flag exceptions before they hit the P&L. This confidence typically enables tighter working capital management and more accurate customer quotes, which can improve competitive positioning on fixed-price bids.
Fewer Internal Price Disputes
Procurement and finance stop debating whether a supplier increase is “reasonable.” The band and the threshold formula provide an objective answer. This eliminates the passive-aggressive email chains where procurement forwards supplier justifications and finance pushes back on principle. The time saved—often 2-4 hours per price-change event across multiple stakeholders—compounds quickly over a year of volatile markets.
Faster Supplier Approval and Switching
When you need to switch suppliers mid-contract due to quality issues, delivery failures, or freight advantage, the normalized to-door model and band structure dramatically speed the decision. You’re not starting from scratch—you already have the comparison framework. Pull up the to-door calculator, input the new supplier’s quote, verify it falls within bands, and approve. What previously took a week of analysis and debate now takes 30 minutes.
These benefits are incremental but real. For a typical SMB converter with significant annual kraft paper spend, the combination of reduced variance, eliminated wasted approval time, and improved agility is designed to help protect margins. This focus on stability and efficiency can create a material impact, translating into direct savings or opportunity cost avoided.
Implementation Resources: Your Starter Kit
The complete system fits on two documents: a one-page flowchart that maps signal-to-action logic, and a copy-ready email template for the Monday review. Both are designed to be self-contained—you can hand them to a new procurement analyst or finance manager with minimal explanation and they’ll understand the system.
One-Page Budget-Stability Flowchart
┌───────────────────────────────────────────────────┐
│ Monday Review (15 min) │
│ Update Signal Dashboard: Pulp | Energy | Freight | FX │
└────────────────┬────────────────────────── ───────┘
│
▼
┌───────────────┐
│ All Signals │───────────► GREEN: No action required
│ Within Band? │ Bands valid, next review in 7 days
└───────┬───────┘
│ NO
▼
┌───────────────┐
│ Breach < 2 │───────────► YELLOW: Flag for awareness
│ Weeks? │ Monitor at next review
└───────┬───────┘ Log in assumption sheet
│ NO (≥2 weeks)
▼
┌───────────────┐
│ RED: Trigger │
│ Escalation │
└───────┬───────┘
│
▼
┌────────────────────────────────────────────┐
│ Escalation Protocol (convene within 48h) │
│ ───────────────────────────────────────── │
│ 1. Verify breach: Which signal(s)? │
│ 2. Assess cause: Pulp/Freight/FX/Supplier? │
│ 3. Evaluate options: │
│ □ Accept variance (if temporary) │
│ □ Renegotiate (if supplier-specific) │
│ □ Switch supplier (if better available) │
│ □ Adjust bands (if market shifted) │
│ 4. Document decision & rationale │
│ 5. Update assumption log │
│ 6. Communicate to stakeholders │
└────────────────────────────────────────────┘
│
▼
┌───────────────┐
│ Implement │
│ Decision │
│ Resume Normal │
│ Cadence │
└───────────────┘
THRESHOLD REFERENCE (customize to your risk tolerance):
• Pulp: ±5-7% sustained > 2 weeks
• Energy: ±8-10% sustained > 2 weeks
• Freight: ±15-20% sustained > 2 weeks
• FX: ±3-5% sustained > 2 weeks
VOLUME ALLOCATION BASELINE (adjust quarterly):
• Fixed-Price: 50-60%
• Index-Linked: 30-40%
• Spot: 10-20%
This flowchart lives on the wall near procurement’s desk and in the Monday review slide deck. When someone asks “what do we do if pulp spikes 8%?” you point to the chart.
Additional Resources
For a comprehensive framework on driver-based benchmarks for kraft paper that covers fiber, energy, freight, and currency drivers, refer to our benchmarking guide. When you’re ready to validate supplier quotes against rational market expectations, use our method to sanity-check supplier quotes before committing to contracts.
Once your budget-stability system is operational, the next strategic step is expanding your supplier and sanity-check supplier quotes work to reduce dependency and improve negotiating leverage. You can find kraft paper suppliers across global markets through PaperIndex’s supplier directory, or submit your RFQ (free) to receive comparable quotes from multiple verified suppliers simultaneously.
For further guidance on international trade terms and responsibilities, the ICC’s official Incoterms guide provides visual reference materials that help teams align on cost allocation and risk transfer. When selecting pulp benchmarks, consulting the Fastmarkets methodology pages offers transparency on how indices are constructed, what data is included, and publication timing—essential context for understanding lag and coverage before committing to index-linked contracts.
A Note on Evidence and Certainty
This playbook combines framework elements verified through PaperIndex’s strategic charter with generally accepted procurement and operations practices. The three-lever system (bands, index-linkage, cadence), the Four Signals threshold approach, and the governance rhythm are drawn directly from the strategic framework. Standard practices like to-door normalization, FX risk management, and energy surcharge handling reflect established methods used across manufacturing procurement. Where implementation details vary significantly by converter context—such as specific band widths, indexed volume share, or MOQ constraints—the guide flags these as adaptable parameters requiring customization to your cost structure, lanes, and risk tolerance.
Disclaimer: This article provides educational guidance on budget management frameworks for kraft paper procurement. The scenarios and threshold examples in this article are illustrative and should be adapted to your specific cost structure, risk tolerance, and market conditions. For specific procurement decisions, consult with your finance and operations teams to validate assumptions against your company’s requirements.
Our Editorial Process
Our expert team uses AI tools to help organize and structure our initial drafts. Every piece is then extensively rewritten, fact-checked, and enriched with first-hand insights and experiences by expert humans on our Insights Team to ensure accuracy and clarity.
About the PaperIndex Insights Team
The PaperIndex Insights Team is our dedicated engine for synthesizing complex topics into clear, helpful guides. While our content is thoroughly reviewed for clarity and accuracy, it is for informational purposes and should not replace professional advice.