

📌 Key Takeaways
True box usage measures every carton consumed—including waste, rework, and internal pulls—not just customer shipments, preventing the phantom consumption that causes surprise stockouts.
- Stock Movement Reveals Reality: Calculate true usage as starting inventory plus boxes received minus ending inventory to capture all consumption categories automatically.
- Lead Time Extends Beyond Transit: Add supplier production days, transit days, and receiving-inspection time to determine when boxes become usable on the packing line.
- Safety Stock Absorbs Variability: Multiply average daily usage by buffer days based on demand volatility, supply uncertainty, and packaging criticality to prevent stockouts during replenishment.
- Reorder Points Eliminate Guesswork: Trigger orders when inventory reaches (average daily usage × lead time) + safety stock, replacing gut instinct with repeatable math.
- Weekly Counts Prevent Crises: Ten-minute cycle counts update triggers before shortages occur, replacing multi-hour emergency sourcing scrambles.
Hope is not an inventory strategy; math is.
Food and beverage operations managers struggling with packaging continuity will gain a practical calculation framework here, preparing them for the step-by-step implementation guide that follows.
The warehouse floor at 7:01 AM. Production is ready to run. And the corrugated boxes needed for today’s orders?
We thought we had enough.
That moment—the sinking realization that inventory assumptions were wrong—costs more than the emergency freight to fix it. It costs production time, customer trust, and the mental bandwidth of everyone scrambling to solve a preventable problem. The hidden economics of damage rates shows how quality failures compound these operational costs.
Stockouts rarely happen because businesses forget to order boxes. They happen because “box usage” gets confused with “boxes shipped.” The two numbers are not the same, and the gap between them is where fulfillment disasters hide.
This guide provides a straightforward method to calculate true box consumption and convert that number into a reorder trigger. No complex software required—a basic spreadsheet handles the math. With this system, inventory decisions move from guesswork to a repeatable routine that keeps operations running smoothly.
What “True Box Usage” Really Includes
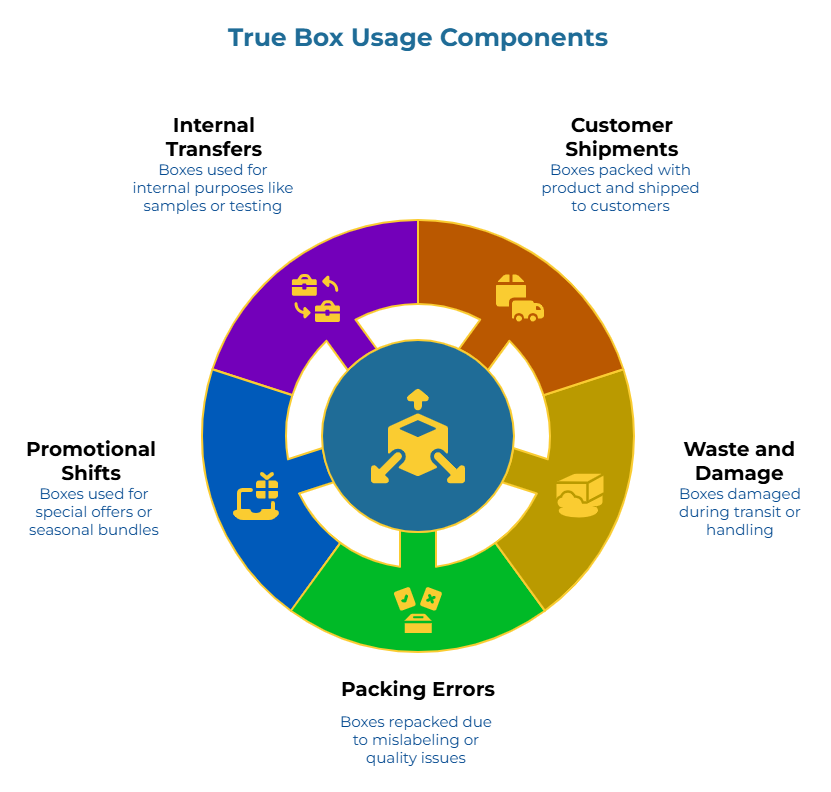
Most businesses track boxes ordered or boxes that leave on trucks. Neither figure captures actual consumption.
True box usage—sometimes called burn rate—measures the total depletion of physical inventory over a specific duration. This includes the obvious: boxes packed with product and shipped to customers. But it also includes categories that rarely appear in shipping reports—what some operations call “phantom usage.”
Waste and damage account for more consumption than most operations realize. Boxes arrive wet from transit humidity. Corners get crushed during warehouse handling. These units never reach a customer, yet they still disappear from available stock.
Packing errors and rework burn through inventory invisibly. A mislabeled shipment requires repacking. A fragile item needs double-boxing after the first attempt fails quality checks. Each correction consumes additional units.
Promotional and seasonal shifts change the boxes-per-order ratio without warning. A holiday gift bundle requires larger packaging than standard orders. A flash sale temporarily doubles volume. These variations spike consumption above historical averages.
Internal transfers represent the most overlooked category. Sample kits for sales meetings. Units pulled for quality assurance testing. Channel-specific packaging trials. None of these show up in customer shipment data, yet all reduce available inventory.
Until these phantom draws get captured in usage calculations, reorder math will consistently underestimate actual need. The result: stockouts that seemed impossible based on the numbers available.
Two Practical Ways to Measure Usage
Accurate measurement does not require perfect inventory systems. Two approaches work for most operations, and cross-checking between them reveals gaps in either method.
Method A: Stock Movement (Recommended)
This approach calculates consumption by tracking what enters and exits the warehouse:
True Usage (boxes) = Starting Inventory + Boxes Received − Ending Inventory
Select a measurement window—28 days works well for most operations. Count boxes at the start of the period. Track every delivery received. Count again at the end. The difference represents actual consumption, capturing every category of usage regardless of where those boxes went.
If a facility begins with 2,400 units, accepts 6,000, and concludes with 1,680, the 28-day burn rate is 6,720 boxes.
Method B: Order-Based Estimate
When physical counts prove difficult, shipment data provides a baseline:
Estimated Usage = Number of Orders × Average Boxes per Order
This calculation captures customer-facing consumption but misses waste, rework, and internal draws. Sample 30-50 recent orders to compute a realistic average. If the business serves multiple channels—wholesale versus direct-to-consumer, for example—calculate separate averages when behavior differs significantly between channels.
Reconciling Method B against periodic Method A counts reveals how much hidden consumption the order-based approach misses. For many F&B operations, the gap runs between 3% and 8% of total volume.
Method A provides the more complete foundation for reorder calculations. Method B offers a useful sanity check and interim tracking tool.
Turn Usage into a Reorder Point
Knowing the burn rate solves half the problem. The other half requires understanding how long replenishment takes and building a buffer for the unexpected.
A reorder point answers one operational question: when should the next purchase be triggered so consumption during lead time does not push inventory to zero?
Four-Step Reorder Point Calculation
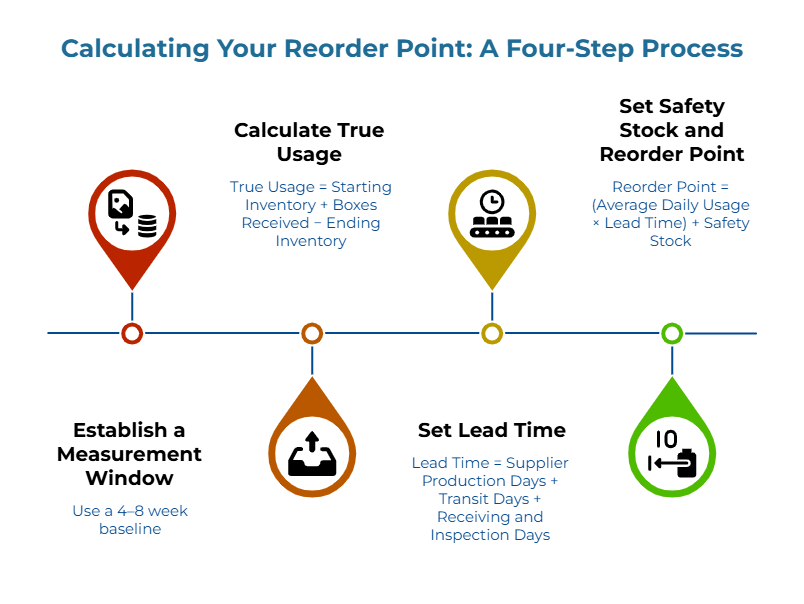
This four-step process converts raw usage data into an actionable inventory trigger:
1. Establish a Measurement Window. Use a 4–8 week baseline to capture operational variance. If the business experiences distinct peak seasons, calculate a separate rate for those periods rather than averaging peaks into normal operations.
2. Calculate True Usage.
- True Usage (boxes) = Starting Inventory + Boxes Received − Ending Inventory
- Average Daily Usage = True Usage ÷ Number of Days in Window
3. Set Lead Time. Add every phase between placing an order and having usable boxes ready for packing—not just production and transit, but the interval from ordering to boxes actually available on the line:
- Lead Time (days) = Supplier Production Days + Transit Days + Receiving and Inspection Days
Lead time is not the number on the supplier quote. Lead time constitutes the total interval between order placement and inventory availability on the packing line. Many operations need receiving, counting, inspection, and staging time before boxes reach the packing line ready for use.
4. Set Safety Stock and Reorder Point.
- Safety Stock (boxes) = Average Daily Usage × Buffer Days
- Reorder Point (boxes) = (Average Daily Usage × Lead Time) + Safety Stock
When current inventory reaches the reorder point, place the next order. The safety stock provides cushion while that order travels through production and transit.
Safety stock exists to reduce stockout risk from variability in both demand and supply. A pragmatic starting point uses buffer days that reflect observed volatility:
- More demand variability (promotions, seasonal spikes, channel shifts) → more buffer days
- More supply variability (inconsistent production scheduling, transit uncertainty) → more buffer days
- More critical packaging (single box type that stops shipping) → more buffer days
Start with a conservative buffer and refine after a few reorder cycles based on actual performance.
Worked Example (Illustrative Numbers)
A small food producer tracks inventory over 28 days:
- Starting inventory: 2,400 boxes
- Boxes received: 6,000 boxes
- Ending inventory: 1,680 boxes
True Usage = 2,400 + 6,000 − 1,680 = 6,720 boxes
Average Daily Usage = 6,720 ÷ 28 = 240 boxes per day
Lead time components:
- Supplier production: 9 days
- Transit: 2 days
- Receiving and inspection: 1 day
- Total Lead Time: 12 days
Buffer selection: 3 days
Safety Stock = 240 × 3 = 720 boxes
Reorder Point = (240 × 12) + 720 = 3,600 boxes
When inventory reaches 3,600 boxes, the next order gets placed. No guessing required.
“Hope is not an inventory strategy. Math is.”
Add Seasonality Without Overcomplicating It
Usage rates shift throughout the year. Holiday rushes, promotional campaigns, and slow periods all change daily consumption. Ignoring these patterns guarantees stockouts during peaks and excess inventory during valleys.
The simplest approach maintains two usage rates: one for normal operations and one for peak periods. Calculate each using the same stock-movement method, drawing data from comparable periods in prior years when available.
When historical data is limited, apply a peak multiplier based on order volume changes. If holiday orders increased 40% last year, multiply average daily usage by 1.4 when calculating peak-season reorder points. This rough adjustment beats using flat averages that underestimate peak demand.
Switching between rates requires discipline. Mark calendar dates when peak calculations activate and when normal rates resume. Waiting until consumption visibly spikes means the switch happened too late.
A 10-Minute Weekly Routine to Prevent Stockouts
Systems only prevent problems when they get used consistently. A brief weekly check keeps numbers current and catches issues before they become emergencies.
The weekly routine:
Count current inventory. Focus on the box SKUs that would stop shipping if they ran out. Many operations use cycle counting—a lightweight approach that keeps physical stock aligned with records without shutting down operations—for high-volume items rather than attempting full inventory verification each week.
Update the tracking spreadsheet. Log current inventory levels and any deliveries received since the last update. The spreadsheet calculates whether current stock sits above or below the reorder trigger.
Check against the reorder point. If current inventory has dropped to or below the trigger number, an order is due.
Place orders with margin. Order when hitting the threshold, not after dropping below it. Lead time calculations assume ordering happens at the trigger point—waiting adds risk the safety stock may not cover.
This routine takes roughly 10 minutes per week. It replaces the multi-hour scramble of emergency sourcing when stockouts hit unexpectedly.
Common Mistakes That Cause Surprise Stockouts
Even with solid formulas, certain oversights consistently trip up otherwise prepared operations.
Ignoring receiving and inspection time. Boxes sitting on a loading dock or waiting for quality checks are not available for packing. If receiving typically adds two days before boxes reach the line, lead time calculations must include those days.
Not counting damaged boxes and packing errors. A 3% damage and rework rate means actual consumption runs 3% higher than shipping records suggest. Over time, that gap accumulates into stockout conditions that seem impossible based on order data alone.
Ordering “when it feels low” instead of at a defined trigger. Gut instinct responds to what catches attention, not what the math predicts. A trigger point removes subjectivity from the decision and ensures orders happen with enough lead time to arrive before stock runs out.
Assuming lead times stay constant. Supplier production schedules stretch during their busy seasons. Freight slows around major holidays. Container availability fluctuates. Building extra buffer days into high-risk periods—or confirming lead times before each order—prevents surprises from upstream delays.
Treating all box sizes as interchangeable. Treating all box sizes as interchangeable. Aggregate inventory numbers mask SKU-level shortages. Running out of one size stops orders requiring that size, even if total box inventory looks healthy. Track each size separately with its own reorder point. For critical SKUs, consider implementing backup sourcing rules to prevent fulfillment disruptions.
From Reactive Ordering to Predictable Control
The goal is not a perfect prediction. Demand fluctuates, suppliers have delays, and unexpected events disrupt even well-planned operations. The goal is a system that triggers action early enough to absorb those disruptions without stopping fulfillment.
Start by tracking actual stock movement for four to six weeks. Calculate average daily usage from that data. Document each component of supplier lead time—not the quoted number, but the actual days from order placement to boxes ready for use. Set an initial safety buffer based on how much variability exists in both demand and supply.
Refine the numbers over time. If stockouts still occur, increase buffer days. If excess inventory accumulates consistently, reduce the cushion. The system improves with each cycle.
For operations ready to move beyond reactive ordering toward strategic supplier relationships, the PaperIndex Academy offers additional resources. The guide on strategic corrugated box sourcing provides a framework for building reliable supply partnerships. When the time comes to expand supplier options, the corrugated box suppliers directory and corrugated boxes product listings offer starting points for discovery.
Frequently Asked Questions
What’s the difference between boxes purchased and boxes used?
Boxes purchased reflect order volume from suppliers. Boxes used reflect actual consumption—including waste, damage, rework, samples, and internal draws that never reach customers. The gap between these numbers causes most inventory planning failures.
How many days of safety stock should be kept for corrugated boxes?
Buffer requirements vary based on supplier reliability and demand consistency. Stable operations with dependable suppliers may function well with 3–5 days of buffer. Operations facing variable lead times or unpredictable demand spikes often require 7–10 days or more. Start conservative and adjust based on actual performance.
What if supplier lead times change?
Recalculate the reorder point immediately using updated lead time figures. Longer lead times require higher reorder triggers to maintain the same safety cushion. Confirming current lead times before placing each order prevents assumptions from causing shortages. For new suppliers, use verification protocols to validate capability before committing to volume orders.
How do I account for seasonal spikes or promotions?
Calculate a separate peak-season usage rate based on historical data from comparable periods. When peak season approaches, switch reorder calculations to the higher rate. If historical data is unavailable, apply a multiplier based on expected order volume increase.
What if multiple box sizes are used?
Track each size as a separate SKU with its own usage rate, lead time, and reorder point. Aggregate inventory numbers hide SKU-level shortages that stop specific orders even when total inventory appears adequate.
How often should inventory be counted?
Weekly counts for high-volume SKUs provide sufficient accuracy for most small and mid-sized operations. Increase frequency during peak seasons or when consumption patterns become volatile. The 10-minute weekly routine prevents the hours-long emergency response that stockouts require.
How do minimum order quantities affect this system?
Minimum order quantities do not change the reorder point trigger itself, but they do affect how much can be ordered when the trigger is reached. Recording MOQs alongside lead times for each key box SKU helps prevent reorder triggers that cannot be executed because the supplier’s minimum exceeds expected order size.
Once you’ve established reliable usage tracking and reorder points, sourcing becomes more strategic. Submit your buying requirements to qualified suppliers when inventory reaches your trigger point—no emergency freight premiums required.
Disclaimer: This content is for informational purposes only and should not replace professional advice. Inventory management approaches vary based on business size, industry requirements, and operational context. The formulas and examples provided represent generally accepted practices; actual implementation should account for specific business circumstances.
Our Editorial Process:
Our expert team uses AI tools to help organize and structure our initial drafts. Every piece is then extensively rewritten, fact-checked, and enriched with first-hand insights and experiences by expert humans on our Insights Team to ensure accuracy and clarity.
About the PaperIndex Insights Team:
The PaperIndex Insights Team is our dedicated engine for synthesizing complex topics into clear, helpful guides. While our content is thoroughly reviewed for clarity and accuracy, it is for informational purposes and should not replace professional advice.