
📌 Key Takeaways
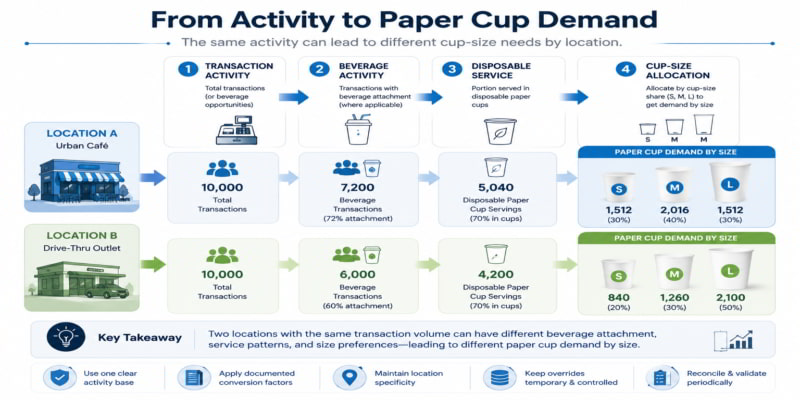
Two locations with the same number of orders can need very different paper cup quantities and sizes — plan by location, not just network totals.
- Start With One Activity Base: Pick either total transactions or beverage transactions as your starting point, and never apply the same conversion twice.
- Use a Location-by-Size Matrix: A single table showing each location’s forecast, beverage mix, and cup sizes keeps every assumption visible and auditable.
- Keep Promotions in a Separate Layer: Temporary events like new drinks or promotions should override the baseline with clear start dates, end dates, and owners — not change it permanently.
- Add Complexity Only When It Helps: Before adding a new factor, confirm it explains a real operational difference and actually changes a planning or purchasing decision.
- Reconcile Against Real Usage: Compare modeled demand with actual cup consumption by location and size, not just the network total.
One matrix, verified inputs, and only the detail that changes a decision.
Procurement and operations teams planning paper cup volumes across multiple locations will find a ready-to-use forecasting framework in the detailed guide below.
~ ~ ~ ~ ~ ~ ~ ~ ~ ~ ~ ~ ~ ~ ~ ~ ~ ~
Two foodservice locations can record the same number of transactions and still require different paper cup volumes. One may attach more beverages to each order. Another may serve more drinks in reusable vessels. Even when their total disposable cup usage is similar, their demand for individual cup sizes may differ substantially.
A network-wide cups-per-transaction ratio can hide these differences. Creating a separate forecasting system for every location is not the solution. A more practical approach is to build a controlled conversion chain from forecast activity to cup-bearing beverage units and then to cup sizes.
The model should become more detailed only when an additional factor explains a stable operational difference, changes a planning decision, or prevents a meaningful allocation error.
Choose One Activity Base Before Adding Conversion Factors
Every demand model needs one clearly defined starting point. For paper cup planning, that base will usually be either total transactions or beverage transactions.
When reliable beverage-transaction or beverage-item data is available, the planning identity can begin with:
Cup-bearing beverage units = forecast beverage activity × disposable-service share
When only total transactions are available, another conversion is required:
Cup-bearing beverage units = forecast transactions × beverage attachment × disposable-service share
Beverage attachment expresses how much relevant beverage activity is associated with the transaction base. The business should document its numerator, denominator, reporting period, and exclusions. Beverage items per order, beverages per guest, and beverages per menu line are different measures and should not be treated as interchangeable.
The same conversion must not be applied twice. For example, multiplying a beverage-transaction forecast by an order-to-beverage attachment rate would normally double-count beverage activity unless the two fields have clearly different definitions.
Before using either base, verify how the source system handles:
- Refills, complimentary drinks, and staff beverages.
- Bundled meals containing a drink.
- Orders with multiple beverages.
- Delivery, kiosk, and catering activity.
- Canceled, refunded, or test transactions.
Purchases should remain separate from this starting point. Purchase quantities may reflect inventory accumulation, transfers, supplier order constraints, timing differences, or corrections from earlier periods. They show what entered the business, not necessarily what locations consumed.
Build The Minimum Viable Location-Level Demand Formula
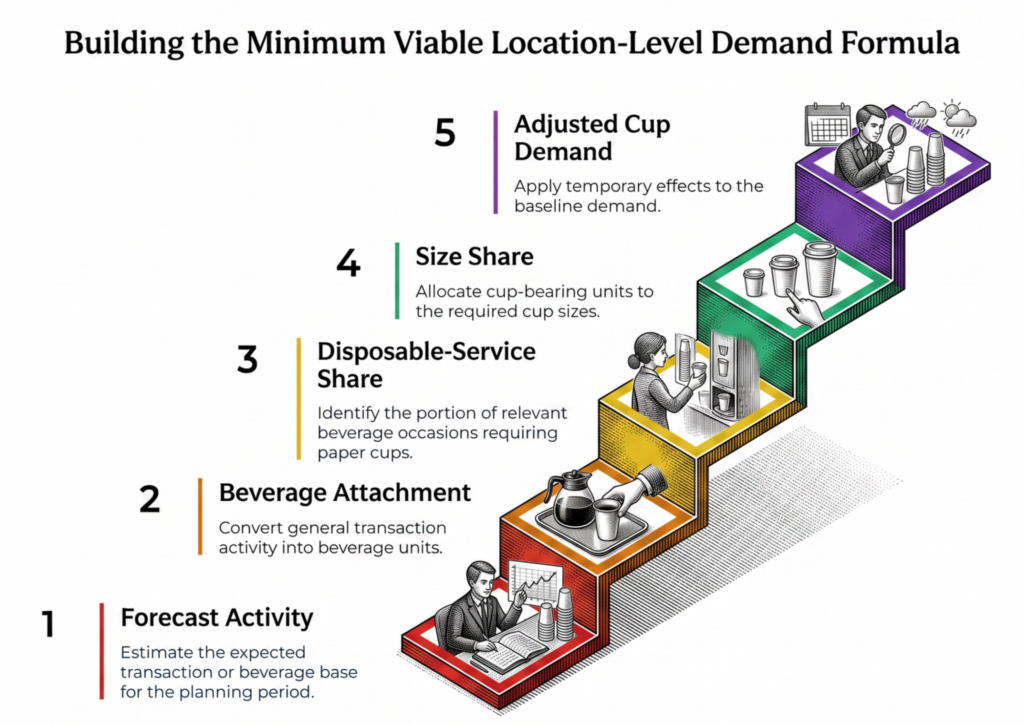
Once the activity base is controlled, calculate demand for each location and cup size:
Baseline cup demand by location and size = forecast activity × beverage attachment, when applicable × disposable-service share × size share
Each factor performs a different job.
Forecast activity represents the expected transaction or beverage base for the planning period.
Beverage attachment converts general transaction activity into beverage units when total transactions are used.
Disposable-service share identifies the portion of relevant beverage occasions that require the modeled paper cup. This rate should reflect actual operating practice rather than assumptions such as “dine-in never uses disposable cups.”
Size share allocates cup-bearing units to the cup sizes or approved SKU families required by procurement. The size shares within a demand group must reconcile to 100%. Otherwise, the model will omit units or allocate them more than once.
Every business-specific factor should be supported by verified internal data or marked as a documented assumption. Each input also needs an owner, effective date, confidence level, and review trigger.
This conversion chain is a planning identity, not a guaranteed prediction or a fitted statistical model. It follows the broader forecasting principle of connecting an outcome to relevant explanatory drivers. Hyndman and Athanasopoulos discuss that principle in Forecasting: Principles and Practice, while caution is still required when translating a general forecasting concept into an operational paper cup model.
Apply temporary effects after the baseline:
Adjusted cup demand = baseline cup demand × documented temporary adjustment factor
An adjustment should identify the affected locations, cup sizes, and time period. Inventory buffers, safety stock, minimum order quantities, and supplier lead times belong in the later purchase-planning stage, not inside the consumption formula.
Use A Location-By-Size Matrix Instead Of Separate Opaque Models
A Location Beverage-Mix Demand Matrix makes each conversion visible while keeping the model manageable.
| Field | Purpose |
| Location or cohort | Identifies the individual location or shared assumption group |
| Forecast activity | Provides the transaction or beverage base |
| Transaction definition | Documents what the activity figure includes and excludes |
| Beverage attachment | Converts total transactions into beverage units when required |
| Disposable-service share | Identifies beverage occasions using the modeled cup |
| Cup-bearing beverage units | Shows demand before size allocation |
| Cup-size or SKU share | Allocates units to procurement-relevant products |
| Baseline cups by size | Calculates structural consumption |
| Temporary adjustment | Applies a dated promotion or menu effect |
| Substitution rule | Records an approved fallback size or SKU |
| Adjusted demand | Shows expected demand after temporary effects |
| Confidence and source | Separates verified observations from assumptions |
| Owner and effective date | Establishes responsibility and version control |
| Review trigger | Defines when the input must be reconsidered |
Begin with a network default or a cohort assumption. Override an input only when a location has a persistent, documented difference.
Menu categories should be modeled only to the level needed for cup allocation. Several beverages that use the same paper cup can often share one category. Creating a separate factor for every menu item adds maintenance without necessarily changing the procurement decision.
The following values are hypothetical and are included only to illustrate the calculation. They are not industry benchmarks.
| Location | Forecast transactions | Beverage attachment | Disposable-service share | Cup-bearing units |
| Location A | 1,000 | 0.60 | 80% | 480 |
| Location B | 1,000 | 0.75 | 64% | 480 |
Both locations produce 480 cup-bearing units, but their size requirements may still differ.
| Location | Illustrative small share | Illustrative medium share | Illustrative large share | Cups by size |
| Location A | 20% | 50% | 30% | 96 / 240 / 144 |
| Location B | 40% | 35% | 25% | 192 / 168 / 120 |
A network total would show 960 cups. It would not show that Location B requires twice as many illustrative small cups as Location A.
Location-size rows should reconcile upward into location totals, size totals, and the complete network forecast. This concept is consistent with the grouped-series structure explained in Forecasting: Principles and Practice, although a practical spreadsheet does not need formal forecast-reconciliation mathematics.
Record substitution mappings separately. Replacing one beverage with another that uses the same cup does not increase total demand. A size substitution reallocates demand between SKUs but may leave the number of cups unchanged.
When a growing number of sizes or SKUs begins to affect product requirements as well as demand planning, review when cupstock specifications should be revisited as paper cup orders become more varied.
Treat Promotions, Menu Changes, And Substitutions As Controlled Overrides
The baseline should represent expected operating conditions without temporary events. Promotions, limited-time menu items, openings, closures, and short-term service changes should sit in a separate override layer.
The Association for Supply Chain Management (ASCM) demand-planning guidance identifies promotional effects and causal drivers as relevant planning inputs. That general principle does not provide a paper cup uplift rate. Any numerical adjustment still requires approved internal history, pilot results, or a documented business assumption.
A controlled override should record:
- The event and affected locations.
- The cup sizes or SKU families are affected.
- Its start and end dates.
- The source and owner of the assumption.
- A removal or replacement trigger.
When the effect is uncertain, use low, expected, and high planning scenarios rather than presenting one unsupported figure as certain.
Consider a new beverage with an unknown size distribution. The initial model can use a provisional scenario without changing the permanent baseline. Once sufficient operating data becomes available, the observed size mix can replace the assumption if the difference proves persistent.
Substitution rules require similar discipline. An item substitution changes paper cup demand only when it changes the cup size, cup type, or number of beverages served. A fallback from one cup size to another should shift demand between SKUs rather than automatically increase total volume.
Add Complexity Only When It Improves A Planning Decision
More data does not always produce a more useful model. Before adding another driver, test it against six questions:
- Does it explain a stable operational difference?
- Is the data consistently available?
- Does it change a size, allocation, inventory, or supplier decision?
- Can a named person or team maintain it?
- Can its effect be checked against observed usage?
- Is its decision value greater than its maintenance cost?

Use a network default when location differences are immaterial. Use cohorts when several locations share stable characteristics. Use location-specific factors for persistent exceptions. Reserve temporary overrides for events with defined start and removal conditions.
A new location can begin with a documented comparable-location or cohort assumption. That input should carry a lower confidence rating and a review trigger. It should be replaced only when actual data demonstrates a stable difference.
Avoid updating factors after every fluctuation. A review is more useful when triggered by a material menu change, service-policy change, repeated reconciliation gap, new operating format, or another event that alters the underlying relationship.
Where adequate history exists, test the model in chronological order: use earlier periods to estimate later periods, then examine whether the same errors continue by location and size. Time-series cross-validation provides the general methodological basis for this type of time-ordered evaluation.
Reconcile The Forecast Before Turning It Into A Purchase Requirement
Compare modeled demand with observed cup consumption wherever reliable inventory-issue or usage data exists. Investigate material differences by location and cup size rather than relying only on the network total.
A variance may originate from:
- The activity forecast.
- Beverage attachment.
- Disposable-service share.
- Size mix.
- Substitution behavior.
- A temporary event assumption.
- Inconsistent data definitions.
Recurring operational feedback should become a defined exception or measurable field before it alters the model.
When important inputs remain uncertain, produce a planning range instead of hiding uncertainty in one exact figure. Procurement can then convert the consumption forecast into a purchase requirement by considering available stock, transfers, lead time, safety stock, order constraints, and delivery timing separately.
Frequently Asked Questions
Does every location need its own paper cup demand model?
No. Use a network default or cohort when locations operate similarly. Add a location-specific factor only when the difference is stable, material, and relevant to a planning decision.
Should the model use total transactions or beverage transactions?
Use the consistently defined base that best represents beverage activity. Total transactions require beverage attachment. A beverage-activity base may not.
How should a new location be modeled without history?
Use a documented cohort or comparable-location assumption, assign a provisional confidence level, and establish a review trigger for replacing the proxy with actual data.
How often should beverage-mix assumptions be updated?
Update an assumption when a material operational change occurs or when reconciliation shows that it no longer explains observed usage. There is no universal update interval suitable for every business.
Start With The Smallest Model That Explains The Difference
A maintainable location-level model begins with one controlled activity base, converts that activity into cup-bearing beverage units, and reconciles demand by size. Persistent differences belong in the baseline. Promotions and menu changes belong in dated overrides.
Start with one location-by-size matrix using verified internal transaction, beverage-attachment, service-channel, and size-share data. Add another driver only when it changes a planning decision.
After documenting size-level requirements, buyers can find paper cup manufacturers and discuss their volume and specification requirements directly with potential suppliers.
Disclaimer:
This article is for general informational purposes only. It is not a substitute for advice from a qualified professional, provider, or official source relevant to your situation. Always verify important decisions with the appropriate expert, authority, or service provider.
Our Editorial Process:
Our expert team uses AI tools to help organize and structure our initial drafts. Every piece is then extensively rewritten, fact-checked, and enriched with first-hand insights and experiences by expert humans on our Insights Team to ensure accuracy and clarity.
About the PaperIndex Insights Team:
The PaperIndex Insights Team is our dedicated engine for synthesizing complex topics into clear, helpful guides. While our content is thoroughly reviewed for clarity and accuracy, it is for informational purposes and should not replace professional advice.