📌 Key Takeaways
Payment terms with kraft paper suppliers and customers rarely align by accident—and that mismatch quietly drains working capital every month.
- Scattered Terms Create Hidden Cash Gaps: When supplier payment days and customer receipt days live across contracts, emails, and memory with no unified view, finance teams react to cash strain without seeing its root cause.
- A 60–90 Minute Mapping Session Reveals the Worst Combinations: Listing your top 3–5 suppliers and 10–20 customers with their actual payment behavior—not just agreed terms—onto a simple timeline exposes which pairings tie up the most cash.
- Rough Data Beats Perfect Analysis: Approximate payment ranges and existing team knowledge are sufficient to build a first map; waiting for precise audit-quality numbers only delays clarity.
- Export Customers and Large Brands Drive the Widest Gaps: Systematic patterns emerge quickly—export accounts often require 75–90+ days due to logistics while mills enforce 30–45 day cycles, creating predictable red zones where overdrafts quietly bridge the difference.
- The Map Becomes the Foundation for Design Conversations: A one-page supplier–customer terms map transforms vague concerns about “tight cash” into specific internal discussions about which lever to adjust first—negotiation, order timing, early-payment discounts, or financing.
Mapping precedes negotiation; clarity precedes control.
Finance heads, CFOs, and procurement leads at SME packaging converters will find a practical diagnostic framework here, preparing them for the detailed step-by-step mapping exercise that follows.
Why Your Payment Terms Feel Messy (and Why a Simple Map Helps)
You pay kraft paper mills on one schedule. Your customers pay you on another. Between those two timelines sits your working capital—stretched, stressed, and often closer to the overdraft limit than you’d like.
The problem isn’t just that payment terms exist; it’s that inflow and outflow data often remain siloed. Details may live in your ERP, but they are rarely viewed holistically. Consequently, the direct correlation between a specific supplier’s credit period and a corresponding customer’s payment behavior is often missed, meaning no one has a single, up-to-date view of how supplier credit days and customer credit days line up. Finance knows roughly what mills expect. Procurement remembers which suppliers tightened terms last quarter. Sales has a sense of which customers habitually pay late. But these fragments never meet on one page.
When upstream suppliers (mills or traders) enforce tighter payment cycles—ranging from advance payment requirements to strict 30–60 day terms—while downstream customers (particularly large brands or retailers) leverage their market power to extend terms to 60–90 days or longer, the result is a structural cash gap that creates overdraft pressure and constant firefighting. Research from institutions including the World Bank highlights that access to finance and late payments remain persistent obstacles for smaller firms globally.
This article walks you through a simple mapping exercise that changes that. You’ll list your top kraft paper suppliers and key customers, capture their current terms and actual payment behavior, and arrange everything so the biggest cash timing gaps become visible. The goal isn’t perfection. Rough numbers and existing knowledge are enough to build your first map.
By the end of a 60–90 minute session, you’ll have a clear view of which supplier–customer combinations are driving most of your cash strain—and a practical starting point for internal conversations about what to adjust.
Executive Summary for Internal Use:
Our supplier and customer payment terms are currently scattered across contracts and memory. This guide provides a step-by-step exercise to list our top suppliers and customers, capture their terms, and spot where cash leaves much earlier than it returns. We only need rough numbers and a 60–90 minute session to complete the first pass.
What You Need Before You Start (People, Data, and Time)
This mapping exercise works best as a collaborative effort. Invite your finance head and procurement lead. If possible, include someone from sales or key account management who understands how major customers actually pay.
Gather the following information before you meet:
For suppliers: Your top 3–5 kraft paper suppliers ranked by spend, volume, or strategic importance. Note their main grades, agreed payment terms (credit days or advance requirements), and any informal flexibilities or recent pressures.
For customers: Your top 10–20 customers ranked by revenue or kraft paper consumption. Capture agreed terms, typical actual payment timing, and notes on consistency or chronic delays.
You don’t need a perfect audit. If a supplier’s contract says 30 days but you usually stretch to 35, write both down. If a customer is contractually obligated to 45 days but habitually pays at 60–70 days due to internal processing delays or working capital policies, that discrepancy creates a ‘hidden’ funding requirement that this exercise is designed to surface.
Plan for 60–90 minutes. The first pass will feel exploratory. That’s normal. You’re building a shared reference point, not finalizing contract amendments.
Step 1: List Your Key Kraft Paper Suppliers and Their Terms
Start with the suppliers who matter most to your production and cash flow. These are typically your top 3–5 by annual spend or the mills whose grades you can’t easily replace.
Create a simple table with these columns:
- Supplier name
- Main grades supplied (e.g., virgin kraft linerboard, recycled testliner)
- Agreed terms (credit days, advance payment percentage, or payment-on-delivery)
- Informal practices (e.g., “Will extend 5–7 days if we call ahead” or “Strict; no flexibility”)
- Reliability notes (e.g., “Consistent lead times” or “Recently tightened credit from 45 to 30 days”)
As you fill this in, mark which suppliers are strict and which have shown flexibility. Note any that require partial or full advance payment, especially for export orders. If a mill recently changed its terms—perhaps tightening credit in response to market volatility—capture that shift.
Example entries might look like:
- Supplier A – core testliner and fluting – 30 days from invoice, 10% advance – sometimes allows 5–10 extra days – recently hinted at stricter enforcement
- Supplier B – higher-strength grades – 45 days, no advance – strict on due dates, rare flexibility
The output is a short, factual list. It should fit on one page and give anyone on your leadership team an immediate sense of where kraft paper cash leaves your business and under what conditions.
Step 2: List Your Key Customers and How They Really Pay
Now turn to the revenue side. List your top 10–20 customers by volume or the accounts that consume the most kraft paper-based packaging.
Use a similar table structure:
- Customer name
- Segment or type (e.g., local FMCG, export brand, large domestic retailer)
- Agreed payment terms (contractual days, noting any applicable prompt payment regulations in your jurisdiction)
- Typical actual payment days (what usually happens, not what the contract says)
- Notes on consistency (e.g., “Pays at 60–65 days every month” or “Erratic; ranges 45–80 days”)
This is where honesty matters. If a customer’s contract promises 45 days but they routinely pay at 70, write both numbers. If another customer occasionally pays early to capture a discount, note that too. Those variations are critical inputs for later design work.
Pay special attention to patterns. Do export customers consistently run longer than domestic accounts? Do certain segments—large brands, smaller distributors—behave differently? These observations will help you see which groups might be open to adjustment.
The goal is a realistic snapshot of when customer cash actually returns, not an idealized version based on signed agreements.
Step 3: Put Supplier Payments and Customer Receipts on a Simple Timeline
You now have two lists. The next step is to see how they interact in time.
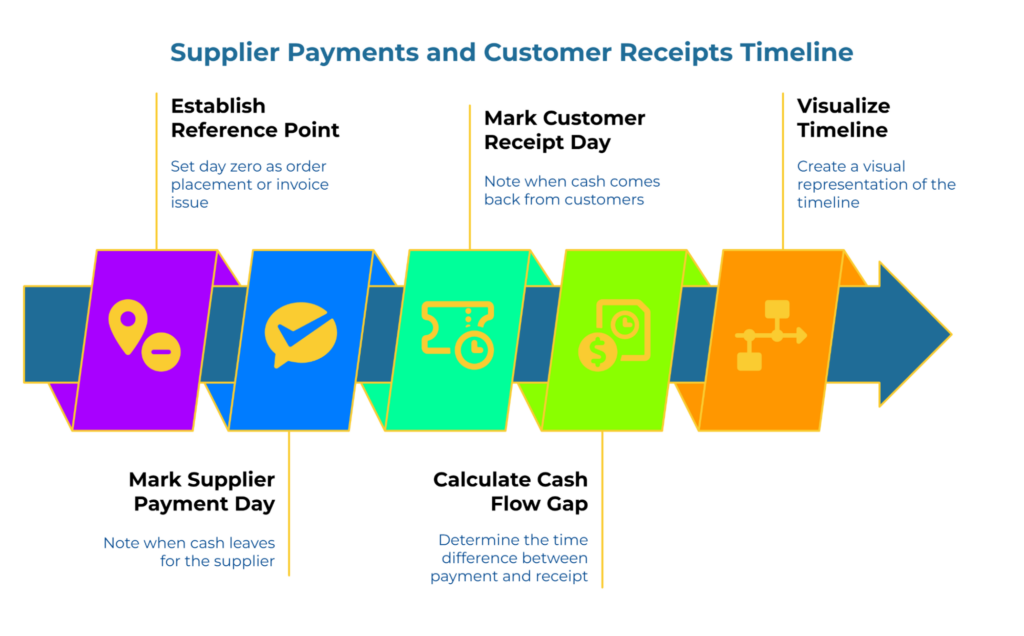
Think in terms of a basic timeline measured in days from a common reference point. For simplicity, use the day you place a kraft paper order or the day the supplier invoice is issued as day zero. Then mark when cash leaves for the supplier and when cash comes back from customers who use that paper.
You don’t need precise daily tracking. Work with rough day buckets: 0, 15, 30, 45, 60, 75, 90, and beyond. On a simple horizontal line or spreadsheet columns, place each supplier’s payment day and each customer’s receipt day.
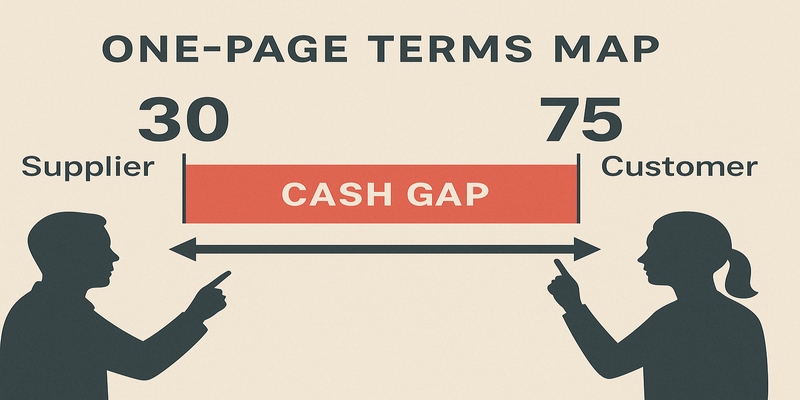
For example, if Supplier A requires payment at 30 days and Customer X pays at 75 days, mark those two points. The gap between them—45 days—represents cash you’ve funded from working capital, overdraft, or delayed payments to other vendors.
Start with a few high-volume combinations. If you source a core grade from Supplier A and convert it for Customer X, that pairing is worth mapping first. Once you see one or two combinations clearly, expand to others.
The visual doesn’t need to be sophisticated. A hand-drawn timeline in a notebook works as well as a formatted spreadsheet. The aim is clarity: where does cash go out, where does it come in, and what sits in between?
Step 4: Spot Your Biggest Cash Flow Gaps
With your timeline in place, look for the widest gaps between supplier payment days and customer receipt days. These are your “red zones”—the combinations that create the most cash strain.
Ask yourself:
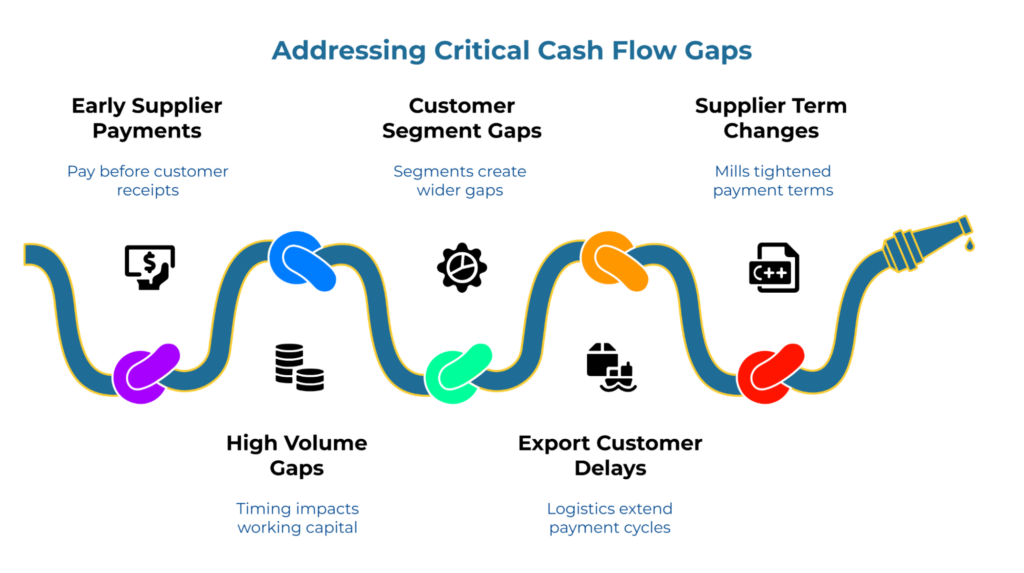
- Where do you pay suppliers significantly earlier than you receive customer cash?
- Are any of these gaps tied to high volumes or strategic grades where a small timing improvement would free meaningful working capital?
- Do certain customer segments consistently create wider gaps than others?
Create a short list of the top 3–5 red zones. Write a line or two for each explaining why it matters. For instance: “Supplier A (30 days) vs Customer X (75 days) on virgin kraft linerboard—our highest-volume grade. Gap: 45 days, roughly $80,000 average monthly exposure.”
You might also notice patterns by customer segment or supplier type. Export customers may consistently require 75–90+ days due to logistics, documentation, and international payment processing. Certain mills may have tightened terms in the past year while customer behavior remained unchanged. Note these observations.
Research from the World Bank on SME finance indicates that long payment cycles and late payments often push smaller firms to depend heavily on short-term borrowing. Seeing the pattern in a simple map helps leadership explain the situation to owners or bankers without blame—just by showing how the current design works.
Remember, the aim is directional clarity, not exact calculations. Rough differences are enough to guide your next steps. If a gap is 40–50 days instead of precisely 47, that’s fine. You’re building a priority list, not a final financial model.
Step 5: Decide What to Carry Into Your Next Conversations
This article stops at mapping and spotting. It doesn’t prescribe which lever to pull—whether you negotiate supplier terms, adjust customer agreements, change order patterns, or explore short-term financing. Those decisions belong in broader strategy discussions informed by your specific constraints and relationships.
What you do have now is a clear, shared picture of where payment terms are creating the most pressure. Summarize your findings into a short list of the most painful gaps, each with a line of explanation. Use this list as input for internal conversations about which lever to try first.
You might bring it to a meeting with finance, procurement, and sales to determine the most realistic remedy. If negotiation leverage is low, the solution may not be changing the contract terms, but rather adjusting inventory holding times, exploring trade financing solutions, or utilizing early-payment discounts to bridge the identified gap. You could use it to frame a conversation with your bank about working-capital facilities sized to bridge specific gaps. Or you might simply schedule a follow-up session to explore design options for one or two of the largest red zones.
The critical shift is moving from vague awareness that “terms are tight” to concrete understanding of where they’re tightest and why. That specificity changes how you approach both internal planning and external negotiations.
How to Use This Article as a Working-Session Agenda
If you’re the finance head, procurement lead, or owner who wants to drive this exercise, here’s a simple way to turn this article into a practical session:
Copy-paste email paragraph:
“I’d like us to spend 60–90 minutes mapping our kraft paper supplier and customer payment terms so we can see where cash timing is creating the biggest strain. I’ve found a guide that walks through a simple step-by-step exercise. Please bring rough numbers on our top suppliers and customers—agreed terms and typical actual payment days. We’ll use the attached table templates to build our first map.”
Suggested agenda:
- 10 minutes – Agree on which suppliers and customers to include
- 25–30 minutes – Fill in the supplier and customer tables (Steps 1 and 2)
- 20–25 minutes – Build a simple timeline for the biggest supplier–customer combinations (Step 3)
- 15–20 minutes – Agree on the top 3–5 red zones and note why they’re painful (Step 4)
- 5 minutes – Capture next steps: who will refine the map and when it will be used in internal planning (Step 5)
Attach or print blank versions of the supplier and customer tables described in Steps 1 and 2. During the session, work through the five steps together, filling in the tables as you go. By the end, capture the top 3–5 gaps you’ve identified and agree on one or two follow-up actions—whether that’s exploring a specific negotiation, adjusting order cycles, or reviewing the findings with your bank.
The session should feel like collaborative problem-solving, not an audit. Focus on building a shared view, not assigning blame.
Where to Go Next Once Your First Map Is Ready
Once you have your first payment terms map, you’re ready for deeper design work. The Payment Terms Design for Kraft Paper Suppliers & Customers: A Simple Playbook to Align Cash In and Cash Out hub article provides a fuller framework for turning your map into a broader strategy—exploring when to negotiate, when to adjust order patterns, and when to use financing to bridge unavoidable gaps.
If the gaps you’ve uncovered feel large and you want to understand how they connect to overall cash flow, the Working Capital Strain from Payment Terms: A Simple Guide to Seeing and Fixing Your Kraft Paper Cash Flow Gap article offers working-capital framing and context.
Remember, mapping is the first step. Design and negotiation can build on it gradually, not all at once. Start with one or two of the biggest gaps. Test small adjustments. See what works. Then expand.
For more in-depth guides, templates, and tools related to kraft paper buying, payment terms, and working capital, explore the PaperIndex Academy.
Disclaimer: This article provides general educational guidance on mapping payment terms for kraft paper suppliers and customers. It is not professional financial, legal, or tax advice. Consult your bank, accountant, or legal advisor for company-specific decisions about payment terms, financing structures, or contract amendments.
Our Editorial Process
Our expert team uses AI tools to help organize and structure our initial drafts. Every piece is then extensively rewritten, fact-checked, and enriched with first-hand insights and experiences by expert humans on our Insights Team to ensure accuracy and clarity.
About the PaperIndex Insights Team
The PaperIndex Insights Team is our dedicated engine for synthesizing complex topics into clear, helpful guides. While our content is thoroughly reviewed for clarity and accuracy, it is for informational purposes and should not replace professional advice.