
📌 Key Takeaways
Freight rate volatility can silently reorder your supplier shortlist between quote and commitment, turning yesterday’s cost leader into today’s second choice.
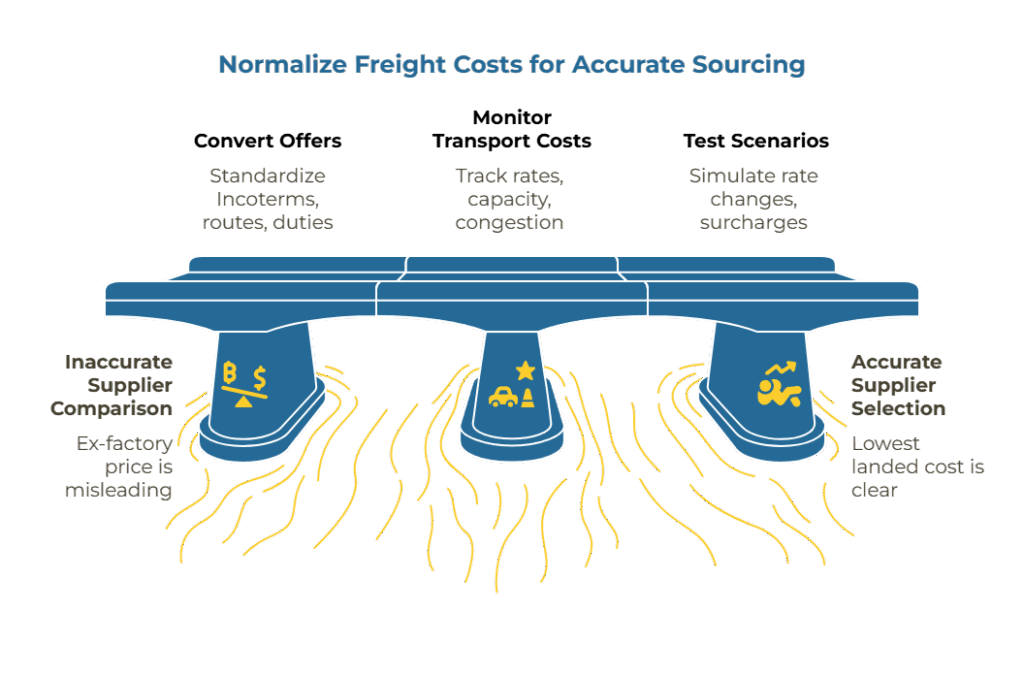
Normalize Before You Compare: Convert all supplier quotes to identical to-door totals (same Incoterms, same route, same duty basis) before ranking—ex-factory anchors mislead when freight, surcharges, and inland costs vary across offers.
Test Three Scenarios, Not One: Run a baseline freight case, a surge scenario (+15-25% for congestion), and a relief scenario (–10-20% for loosening capacity) to expose which supplier’s advantage survives realistic rate shifts.
Surcharges Flip Rankings: Peak Season Surcharge (PSS), General Rate Increase (GRI), and other carrier fees can add 15-25% to base rates during tight markets—omitting them from scenario grids understates volatility and risk.
Document Every Assumption: Log the freight rate source, validity window, port pair, FX basis, and surcharge set used in each scenario; stale or undocumented assumptions create false precision and post-PO disputes.
The Grid Is the Decision Tool: Present the 3-scenario comparison as a single-page grid showing to-door totals, rank order, and delta-to-winner for each case—make it the approval packet’s anchor, not an appendix.
Choose the supplier whose normalized landed cost holds across plausible freight conditions, not the one that wins a single snapshot.
For procurement managers, logistics coordinators, and finance teams responsible for sourcing decisions in volatile freight markets, these principles turn reactive supplier selection into strategic, scenario-tested sourcing.
The freight quote just moved.
A logistics email lands in your inbox at 4:47 PM, and suddenly the supplier shortlist that felt solid this morning now looks unstable. That’s because ocean freight rates can shift between quote and commitment—and when they do, supplier rankings can completely reorder unless the comparison is built on normalized to-door totals.
Executive Summary
When ocean freight rates shift, supplier rankings can completely reorder—turning yesterday’s best value into today’s runner-up. Procurement teams that anchor decisions on ex-factory pricing risk missing these swings. The solution: normalize all kraft paper quotes to comparable to-door totals, then run three scenarios (baseline, surge, relief) to test how rate volatility affects your shortlist. Choose the winner based on normalized landed costs across scenarios, not stale assumptions.
Featured Takeaway:
Run a 3-scenario grid—Baseline, Rates +X% (congestion), Rates –X% (capacity loosening)—on normalized to-door totals for every supplier. Note any rank flips and the delta-to-winner. Choose the supplier that remains competitive across plausible freight conditions, not the one that wins a single snapshot.
The Problem: Freight Can Quietly Reorder Your Shortlist
Picture the final stage of a kraft paper sourcing project. Three kraft paper suppliers have submitted quotes, and the team is ready to issue a purchase order. Supplier A quoted the lowest ex-factory price. The decision feels straightforward.
Then logistics flags a rate update. Ocean freight jumped 18% since the quotes were gathered. When the procurement manager recalculates the to-door totals, Supplier B—previously in second place—now delivers the lowest landed cost. The ranking flipped, and the team nearly committed to the wrong supplier.
This scenario plays out more often than most teams realize. Freight is a swing factor in to-door comparisons. Ocean base rates are only part of the story; carriers also apply surcharges like Peak Season Surcharge (PSS), General Rate Increase (GRI), and emergency fees that can shift the apparent winner when totals are normalized. These charges are real, subject to regulatory oversight, and they come and go with market conditions.
Freight markets are volatile. Rate cycles, capacity changes, and port congestion can move ocean costs enough to flip rankings—particularly when suppliers are close within a few percentage points. Monitoring transport cost drivers and testing scenarios is a widely accepted practice to reduce the risk of choosing based on a transient rate.
To compare apples to apples, convert all offers to a normalized to-door basis: same Incoterms interpretation, same route and legs, same duty and tax logic. Think of it as a recipe to door—you need to measure each cost ingredient (terms, freight, duties) before comparing the final dishes. Incoterms define who bears tasks, costs, and risks, so mixing FOB, CFR, or DDP without normalization misleads the comparison.
The core issue isn’t the volatility itself—it’s the anchoring bias that comes from focusing on ex-factory pricing. When buyers compare suppliers using only the mill-door price, they’re essentially ignoring the cost of getting the material to their facility. That works fine when freight remains stable and consistent across all suppliers. It falls apart the moment rates diverge or shift significantly.
Agitate: How Anchors and Non-Normalized Totals Mislead

The anchoring problem runs deeper than most teams acknowledge. Once a buyer sees kraft paper Supplier A’s lower ex-factory price, that number becomes the reference point for all subsequent comparisons. Even after logistics provides updated freight estimates, the original anchor creates a subtle psychological pull. The team wants Supplier A to remain the winner because that’s what the initial analysis suggested.
Non-normalized totals compound the confusion. When kraft paper quotes arrive on different Incoterms—one EXW, another FOB, a third CIF—comparing them directly is like measuring distance in miles, kilometers, and nautical miles without converting to a common unit. The numbers tell you nothing useful until you normalize them to the same basis: the cost to get the material through your receiving dock.
Without that normalization, teams make decisions on incomplete data. The procurement manager sees a $50-per-ton gap between two suppliers and assumes it’s meaningful. But once freight, insurance, inland haulage, and duties are layered in, that gap might shrink to $5 per ton—or reverse entirely if one supplier’s quoted terms already include costs the other left out.
This gets worse when rate volatility enters the picture. A baseline freight estimate might show Supplier A winning by a comfortable margin. But if that estimate is two weeks old and a port congestion surcharge just went into effect, the actual landed cost could be materially different. The team is making a high-stakes decision using stale assumptions, and the financial exposure can be significant when multiplied across annual volume commitments.
For duties and tariff treatment, reference the HS classification and applicable trade programs; these materially affect to-door totals and should be kept constant across suppliers.
Solve: The 3-Scenario Grid (Baseline, Surge, Relief)

The solution is to test multiple freight scenarios before finalizing the supplier decision. This approach reduces anchoring bias and exposes how sensitive your ranking is to rate changes. Instead of relying on a single freight assumption, run three cases and compare how each supplier performs under different conditions.
Baseline Freight (Recent Contracted Rate)
Start with your current or most recently contracted ocean freight rate. Normalize all supplier quotes to to-door totals using this baseline. Calculate the full landed cost for each supplier: ex-factory price, plus freight, plus insurance, plus inland haulage, plus applicable duties.
Rank the suppliers based on these normalized totals. Document the delta between the winner and each runner-up. This establishes your reference case—the ranking that holds if freight remains stable.
Rates +X% / Congestion Case
Now model a scenario where ocean freight increases due to port congestion, carrier surcharges, or seasonal demand spikes. Use a percentage increase that reflects realistic volatility for your trade lane—commonly 15-25% for sudden congestion events, though this varies by route and timing.
Recalculate the to-door totals using the higher freight rate. Check the ranking. Did Supplier B overtake Supplier A? Did the gap between first and second narrow to the point where other factors (lead time, quality track record, payment terms) should influence the decision?
This scenario answers a critical question: how fragile is your current winner’s advantage? If a modest rate increase causes a rank flip, that’s a red flag. The shortlist is more volatile than it appears, and the team should factor that risk into the final decision.
Rates –X% / Capacity Loosening
The third scenario tests the opposite case: freight rates decline because carrier capacity loosens, fuel costs drop, or competitive pressure drives pricing down. Model a 10-20% reduction from baseline and recalculate.
Does this create a new tie between two suppliers? Does a third supplier—previously dismissed as too expensive—suddenly become competitive? This scenario is particularly valuable for longer-term contracts where the buyer wants to understand which supplier offers the best value if market conditions improve.
Close the grid with a clear directive: pick the winner based on normalized to-door totals across all three scenarios, not on ex-factory price alone. The supplier that maintains the lowest landed cost—or performs well across multiple scenarios—is the more resilient choice.
3-Scenario Grid:
Use this template to stress-test your shortlist. For each scenario, list the to-door total per supplier, the rank order, and each supplier’s Δ to #1 (delta-to-winner). This grid should be the single source of truth in your approval packet.
| Supplier | Baseline freight – To-door total | Rank | Δ to #1 | Rates +X% / congestion – Updated total | Rank | Δ to #1 | Rates –X% / capacity loosening – Updated total | Rank | Δ to #1 |
| A | ____ | __ | ____ | ____ | __ | ____ | ____ | __ | ____ |
| B | ____ | __ | ____ | ____ | __ | ____ | ____ | __ | ____ |
| C | ____ | __ | ____ | ____ | __ | ____ | ____ | __ | ____ |
(Template is illustrative; fill with your normalized numbers. This is not a price claim.)
What this grid demonstrates:
- Freight is a swing factor; rankings can flip across scenarios
- Scenario testing reduces anchoring bias
- The decision should reference normalized to-door totals
How to Run Freight Scenarios Without Live Prices

Most teams don’t have access to real-time ocean freight pricing, and that’s fine. The goal isn’t precision to the dollar—it’s to understand directionality and sensitivity.
Normalize the commercial basis first. Convert all supplier quotes to the same to-door endpoint and date assumptions. Align Incoterms and legs before you touch the freight number.
Select a defensible baseline. Use the most recent firm quote or a recent internal actual. If using public indices, use them for directional deltas only; avoid implying live prices in stakeholder documents.
Construct the three scenarios. Run baseline freight, rates +X% for the congestion case (simulating seasonal surcharges or rate increases), and rates –X% for capacity loosening (simulating easing conditions). Ensure the same surcharge set is considered in each scenario; carriers publish surcharge advisories such as PSS or GRI that can materially change totals.
Keep duties and HS classification constant. Changing HS code or origin shifts totals for reasons unrelated to freight; lock classification for comparability across all suppliers.
Document FX and validity. Note the exchange rate used and any rate validity windows or Bunker Adjustment Factor (BAF) or Fuel Adjustment Factor (FAF) adjustments that could roll between quote and booking.
Publish the grid in the approval packet. Make the grid the one-pager the team uses to decide. This creates accountability and makes it easier to reconcile actual costs against the estimate later.
For teams using a landed-cost framework, the scenario grid becomes a natural extension of the normalization process. Once quotes are adjusted to a common Incoterm basis—as detailed in comparing quotes across Incoterms—running the three freight scenarios is a straightforward next step.
Risk Table: Freight Scenario Assumptions
| Assumption | If Wrong… | Impact on Ranking | Owner |
| Freight basis stale (>14 days) | Baseline is understated | Supplier #2 may become #1 | Logistics |
| Wrong port or haulage leg modeled | Missing inland cost component | Rank volatility high | Procurement / Logistics |
| Carrier surcharge omitted (PSS/GRI) | Surge case underestimates flip | Ranking may flip | Logistics |
| FX basis unlogged | Totals shift relative to original quote | Apparent winner changes | Finance |
Checklist: Before You Send the PO
Attach normalized to-door totals for all suppliers.
Verify that the final comparison uses to-door totals, not ex-factory prices. The approval summary should clearly state the Incoterm basis used for normalization.
Include the 3-scenario grid in the approval packet.
All three suppliers should have normalized to-door totals calculated for each scenario (baseline, surge, relief).
Log all freight assumptions and sources.
Document the freight rate source, validity window, port pair, and any surcharges included or excluded. This creates accountability and makes reconciliation easier.
Record any rate validity windows used.
Note how long the freight assumptions remain valid. If the quoted rate expires before the PO is issued, flag this as a risk and consider requesting a rate confirmation from logistics or the freight forwarder.
Common Questions
What exactly should be normalized?
Incoterms obligations, route and legs, duties and taxes based on HS classification, currency and FX basis, and all freight elements including surcharges. Each supplier’s quote should be converted to the same to-door endpoint using the same cost assumptions.
Are surcharges really significant?
Yes. Carriers may publish surcharges such as Peak Season Surcharge (PSS) or General Rate Increase (GRI) that meaningfully change ocean cost. These charges are subject to regulatory oversight for reasonableness and transparency, but they can add 15-25% to base rates during peak periods.
Why three scenarios?
They counter anchoring bias and show whether a supplier’s advantage survives plausible freight moves—critical when short-listed totals are close. Testing multiple scenarios reduces the risk of choosing a supplier based on a transient rate snapshot.
The shortlist can flip when a congestion surcharge hits—but only if the team is anchoring on ex-factory price instead of testing scenarios. By normalizing quotes, running the three freight cases, and documenting every assumption, procurement moves from reactive decision-making to strategic sourcing. The winner isn’t the supplier with the lowest mill-door price. It’s the supplier whose to-door total holds up across realistic market conditions.
For teams managing common pitfalls in landed-cost estimates, scenario testing is a critical defense against invoice disputes and budget overruns. When freight volatility is part of the analysis—not an afterthought—the PO reflects the true cost of getting kraft paper to the converting line.
Where to Go Next
Parent hub:
The Landed-Cost Framework for Kraft Paper: From Incoterms to To-Door Comparability
Related guides:
- Comparing Quotes Across Incoterms: A Practical Normalization Method for True To-Door Decisions
- Common Pitfalls in Landed-Cost Estimates (and How to Avoid Invoice Disputes)
Disclaimer: This article provides general guidance on freight scenario analysis for procurement decisions. Actual freight rates, trade lane volatility, and duty calculations vary by geography, carrier agreements, and product specifications. Consult with logistics, trade compliance, and finance teams to ensure all cost elements are accurately modeled for your specific sourcing context.
Our Editorial Process
Our expert team uses AI tools to help organize and structure our initial drafts. Every piece is then extensively rewritten, fact-checked, and enriched with first-hand insights and experiences by expert humans on our Insights Team to ensure accuracy and clarity.
About the PaperIndex Insights Team
The PaperIndex Insights Team is our dedicated engine for synthesizing complex topics into clear, helpful guides. While our content is thoroughly reviewed for clarity and accuracy, it is for informational purposes and should not replace professional advice.