
📌 Key Takeaways
Matching your actual weekly parent roll usage against supplier minimums protects both cash flow and production continuity.
- Know Your Real Consumption First: Pull 8–12 weeks of stable production data to find your true weekly parent roll usage—not machine specifications or budget guesses.
- Convert Tonnage into Time: Divide the supplier’s minimum order by your weekly consumption to see how many weeks that order actually covers.
- Build a Range, Not a Single Number: Create base, conservative, and stretch order sizes so you can flex with demand swings without guessing.
- Test Before You Commit: Ask what happens if demand rises 15%, drops 20%, or lead times slip—fragile numbers fail under real conditions.
- Treat the MOQ as a Constraint, Not the Answer: The supplier’s minimum is their floor, not your ideal order—your internal data decides what fits.
Clearer run-rate data turns reactive ordering into disciplined procurement.
SME toilet tissue converters managing tight margins and working capital will gain a practical framework here, preparing them for the step-by-step methodology that follows.
~ ~ ~ ~ ~ ~ ~ ~ ~ ~ ~ ~ ~ ~ ~ ~ ~ ~
A supplier states their minimum order quantity for bathroom tissue parent rolls. The number sounds reasonable until the question surfaces: how many weeks of production does that volume actually cover? Without internal run-rate data, the answer is a guess. And guessing on parent roll orders creates two primary problems — too much cash locked in inventory, or too little stock to keep converting lines running.
This gap between supplier MOQ requirements and internal production visibility is where toilet tissue converters lose control of their working capital. SME converters frequently struggle to align production cadence with MOQ evaluation requirements.
Run-rate-to-MOQ mapping is the process of converting historical toilet tissue production output into a weekly parent roll consumption figure, then comparing that figure against supplier minimum order thresholds. Think of it like stocking a restaurant kitchen: bulk purchasing can reduce unit cost, but ordering more than the kitchen can use before the next delivery cycle leaves cash frozen while daily operations still need funding.
The method that follows is a five-step framework for building a defensible order-size band — not a single perfect number, but a range that protects against both stockouts and unnecessary cash lock-up.
Why Toilet Tissue MOQ Planning Fails When Run-Rate Data Is Guesswork
MOQ pressure feels like an external constraint imposed by a bathroom tissue paper supplier. In practice, the real vulnerability is internal. When a converter cannot answer the question “how many metric tonnes of parent rolls do we actually consume per week,” every MOQ conversation starts from weakness.
Too much toilet tissue inventory does not just occupy warehouse space. It ties up working capital that could fund payroll, maintenance, or the next raw material order. For a small converter operating on tight margins, a single over-order can create weeks of cash-flow strain. Conversely, under-ordering creates supply gaps that force expensive spot purchases or halt production entirely.
Most converters follow a reactive pattern: the last three purchase orders show wildly different quantities with no documented rationale. Each decision was reactive — responding to a supplier’s available lot size, a perceived deal, or a vague sense that “we’re running low.” Without a baseline consumption figure, there is no anchor for evaluating whether a given MOQ makes operational sense.
Foundational Variables: Run Rate vs. Supplier MOQ
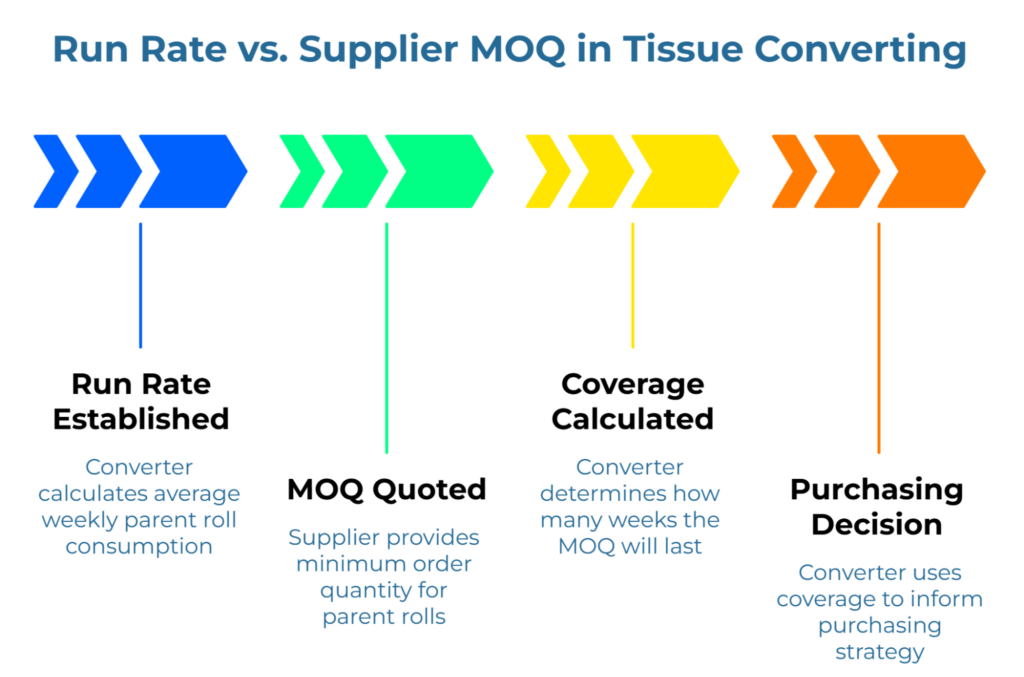
The entire framework rests on two variables.
A production run rate in bathroom tissue converting is the average quantity of parent roll material consumed per unit of time — typically expressed as metric tonnes per week. This figure reflects actual converting activity, not theoretical machine capacity or annual projections divided by 52.
A supplier MOQ is the minimum volume a supplier will ship in a single order. For toilet tissue parent rolls, MOQs are commonly expressed in metric tonnes and may range from a single container load to multiple containers depending on the supplier’s production and logistics setup.
The goal is to express both variables in the same unit of measurement so they can be directly compared. When a supplier quotes a 40-tonne MOQ and the converter knows internal consumption runs at 8 tonnes per week, the MOQ represents five weeks of coverage. That insight — not the raw tonnage figure — is what informs the purchasing decision.
Gather 8 to 12 Weeks of Toilet Tissue Production Data
Start by pulling production records from the most recent 8 to 12 weeks of stable operations. Avoid periods with unusual spikes, extended downtime, or one-off contract jobs that do not represent typical converting activity.
The records that matter are those showing actual parent roll consumption — not finished goods output alone. If production logs track finished toilet tissue rolls produced, work backward using known yield ratios to estimate the parent roll tonnage consumed. The precision does not need to be exact, but the figures should reflect real operations rather than nameplate capacity or budget projections.
Recent data matters more than historical averages. A 12-month average may obscure seasonal patterns or recent changes in product mix. Eight to twelve weeks of current, stable production provides a baseline that reflects how the converting line actually operates today.
Quantifying Weekly Consumption
With raw data in hand, calculate a weekly average. If the past ten weeks consumed 78 metric tonnes of toilet tissue parent rolls, the weekly run rate is 7.8 tonnes.
Standardize units across all datasets to prevent downstream conversion errors. Mixing tonnes and kilograms or shifting between weekly and monthly figures introduces conversion errors that compound downstream.
Separate core volume from anomalies. If one week included a large private-label order that will not repeat, exclude it from the baseline or note it as an exception. The goal is a stable figure representing normal operations — the volume the converting line will consume week after week under typical conditions.
Translate Supplier MOQ into Inventory Coverage Time
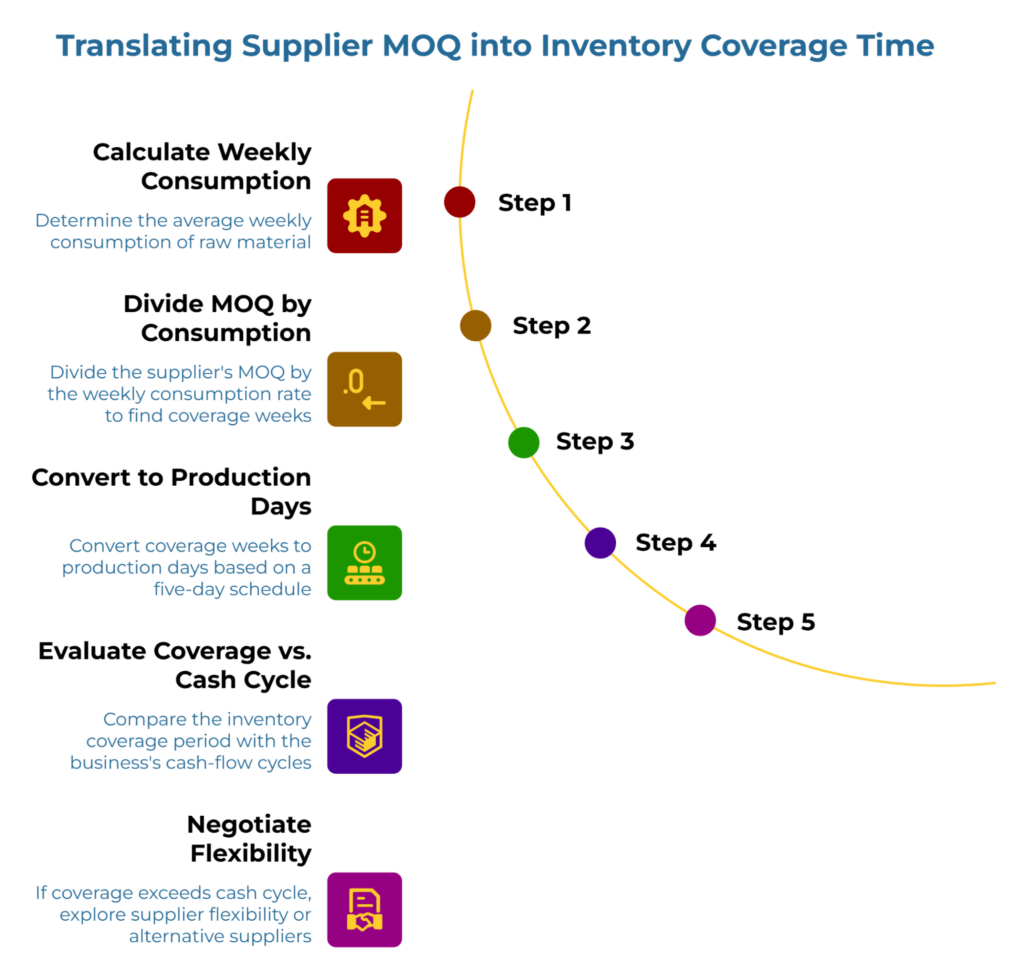
This step transforms the supplier’s MOQ from an abstract tonnage figure into a concrete operational metric: days or weeks of production coverage.
The calculation is straightforward. Divide the supplier’s MOQ by the weekly consumption rate. If a supplier’s MOQ is 40 metric tonnes and weekly consumption is 7.8 tonnes, that MOQ represents approximately 5.1 weeks of inventory coverage.
Another converter might see different numbers. A business with a base-case parent roll consumption of 18.6 tonnes per week evaluating a 74-tonne MOQ would find that one order covers roughly 4 weeks of production — or about 20 production days on a five-day schedule. The MOQ is larger in absolute terms, but the coverage period is actually shorter because the operation consumes material faster.
The insight this creates is immediate. A converter can now evaluate whether a given coverage period aligns with cash-flow cycles, storage capacity, and demand stability. If the business operates on 30-day payment terms but the MOQ creates 10 weeks of coverage, the mismatch becomes visible before the order is placed rather than after cash is committed.
When one MOQ creates more coverage than the cash cycle can tolerate, the next supplier conversation changes. Instead of accepting the MOQ as fixed, the converter can explore whether the supplier offers flexibility for established customers, whether splitting shipments is possible, or whether a different supplier’s MOQ structure fits better.
The Order-Size Band: Strategic Range vs. Fixed Targets
A single “correct” order quantity assumes stable demand, reliable lead times, and predictable cash flow. Reality is messier. Building an order-size band accommodates variability without abandoning discipline.
Base case: The weekly run rate multiplied by a target coverage period. If the goal is six weeks of coverage at 7.8 tonnes per week, the base case order is approximately 47 tonnes.
Conservative case: The base case reduced by 15–20% to preserve cash flexibility or accommodate demand uncertainty. This might mean ordering 40 tonnes instead of 47.
Stretch case: The base case increased modestly to capture volume pricing or bridge an anticipated lead-time gap. Perhaps 52 tonnes if the supplier offers meaningful price breaks at that threshold.
A practical order-size band answers three questions: What is the minimum safe coverage before stockout risk becomes uncomfortable? What is the normal operating coverage that matches the usual procurement rhythm? And what is the maximum cash-tolerable coverage before parent roll inventory starts freezing too much working capital?
The band provides a decision framework rather than a single number. When the supplier quotes an MOQ of 44 tonnes, the converter can immediately see that this falls within the acceptable range — above the conservative floor, below the stretch ceiling. If the MOQ sits outside that band, the issue is not simply commercial. It is structural.
Stress-Test the Band Against Stockout Risk and Cash Lock-Up
The order-size band is a starting point, not a final answer. Before committing, pressure-test the numbers against realistic scenarios.
If demand rises: A 15% increase in orders would push weekly consumption to approximately 9 tonnes. Does the planned order still provide adequate coverage, or does the buffer shrink dangerously?
If demand softens: A 20% drop in orders extends coverage duration. Would the order create excess inventory sitting longer than acceptable? What are the storage and cash-flow implications?
If lead time slips: Supplier lead times are not guaranteed. If the typical 6-week lead time stretches to 8 weeks due to shipping delays, does the order-size band still prevent stockouts?
These stress tests do not require sophisticated modeling. Simple “what if” calculations reveal whether the band is robust or fragile. The point is safer decisions, not elegant forecasting.
Common Mistakes Toilet Tissue Converters Make When Mapping Run Rates to MOQs
Three errors appear repeatedly.
Using nameplate capacity instead of actual run-rate data. Machine specifications describe what equipment can do under ideal conditions. They do not reflect maintenance downtime, changeovers, quality holds, or demand fluctuations. Run-rate mapping requires real consumption figures, not theoretical maximums.
Mixing unlike SKUs or converting patterns to create a single average. A converter producing both premium three-ply and economy single-ply toilet tissue may have very different parent roll consumption rates for each line. Blending them into a single average obscures the actual demand pattern and leads to ordering decisions that fit neither product well.
Treating supplier MOQ as the answer instead of a constraint. The supplier’s MOQ is their minimum, not the converter’s optimal order. Once internal run-rate data exists, the MOQ becomes one input among several — not the automatic order quantity.
What This Mapping Unlocks Next in Toilet Tissue Procurement
Completing this run-rate mapping exercise creates a foundation for more advanced procurement discipline.
Supplier conversations become more productive when the converter arrives with clear consumption data and coverage calculations. Instead of reacting to whatever MOQ the supplier proposes, the procurement lead can evaluate fit against documented internal requirements.
Landed-cost normalization becomes possible once order quantities are standardized. Comparing quotes from different bathroom tissue parent roll suppliers requires expressing all offers against the same volume baseline — a baseline that run-rate mapping provides. When that stage arrives, standards like ISO 536 for grammage determination, ISO 287 for moisture content, and the universally recognized ICC Incoterms® 2020 rules become relevant — though they belong in that later stage, not here. For a deeper treatment of quote normalization across Incoterms, see a practical framework for normalizing global EXW and CIF toilet tissue raw material specifications.
Supplier verification also sharpens when procurement knows exactly what volume and coverage period each order must deliver. The framework in our guide, beyond the broker: three steps to direct toilet tissue raw materials supplier authentication assumes the buyer has already defined internal requirements — run-rate mapping is how those requirements get documented.
For converters ready to audit their current supplier specification practices, the first 72 hours: auditing your current toilet tissue parent roll supplier specifications provides a structured starting point.
Explore more toilet tissue sourcing guides in PaperIndex Academy.
Disclaimer
This content is for informational purposes only and does not constitute financial, operational, or professional procurement advice. Production run rates, inventory requirements, and MOQ suitability vary by facility, equipment, demand patterns, and market conditions. Consult qualified operations and financial professionals before making purchasing decisions. Individual outcomes depend on specific circumstances.
Our Editorial Process:
Our expert team uses AI tools to help organize and structure our initial drafts. Every piece is then extensively rewritten, fact-checked, and enriched with first-hand insights and experiences by expert humans on our Insights Team to ensure accuracy and clarity.
About the PaperIndex Insights Team:
The PaperIndex Insights Team is our dedicated engine for synthesizing complex topics into clear, helpful guides. While our content is thoroughly reviewed for clarity and accuracy, it is for informational purposes and should not replace professional advice.