
📌 Key Takeaways
Price alone tells you nothing—three quotes for “120 GSM kraft paper” can hide 15% cost swings once you account for spec drift, Incoterms differences, and hidden local charges.
- Spec-True RFQs Freeze Comparability: Locking basis weight tolerances (±2 vs. ±5 g/m²), moisture limits, and test methods (ISO 536, ISO 287, ISO 2758) before suppliers quote eliminates ambiguity and prevents yield penalties that erase apparent savings.
- Evidence-First Quotes Replace Promises with Proof: Method-ID lab reports, calibration logs, and sampling plans per ISO 186 confirm suppliers can deliver what they promise, cutting post-delivery disputes by 30–50% and turning claims discussions into 10-minute sealed-sample comparisons.
- To-Door Normalization Reveals True Cost: Converting every EXW, FOB, CIF, or DDP offer to the same delivery basis—by adding freight, insurance, duties, port fees, and inland haul—exposes the real winner; a $680 EXW quote routinely becomes $820 to-door while a $750 CIF lands at $818.
- Freight Stress-Tests Prevent Rank Flips: Running baseline, +30% surge, and –15% relief scenarios shows which supplier holds rank when Peak Season Surcharges or General Rate Increases hit, protecting you from awarding a contract that becomes 8% more expensive before shipment.
- Effective Cost Per Usable Ton Adjusts for Reality: Dividing quoted price by [(1 – moisture%) × (1 – trim%) × (1 – variance%)] reveals that a supplier quoting $750 with 8% moisture and loose tolerances delivers $862 per usable ton, while $780 with 7% moisture and tight specs lands at $868—nearly identical after accounting for what you actually convert.
Spec-first, evidence-backed, and normalized to-door: that’s how procurement, finance, and operations all approve the same supplier with confidence.
Procurement managers, category buyers, quality assurance leads, and mill sales teams will find this framework here, preparing them for the detailed playbook and worked examples that follow.
You’re reviewing three kraft paper quotes. One mill offers $680/MT EXW, another quotes $720/MT FOB, and a third proposes $750/MT CIF. Which one wins?
The honest answer: you can’t tell yet. Without knowing whether the basis weight tolerances match, whether the moisture specs align, or what local charges apply at your destination port, those numbers are just noise. A $680 quote can easily become $820 at your door once you factor in freight, insurance, duties, and the yield loss from off-spec moisture. Meanwhile, a $750 CIF offer from a mill with tighter process control might deliver better effective cost—and far less
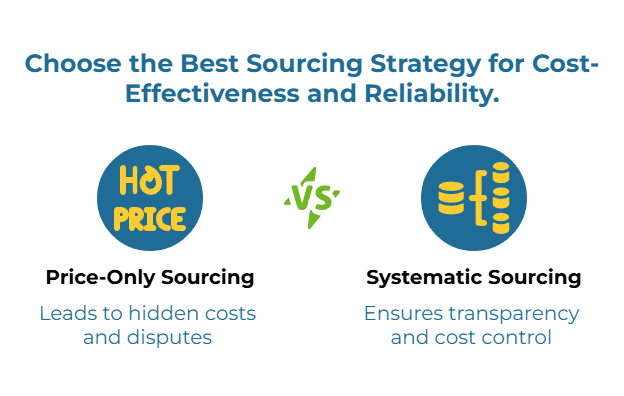
Price-only sourcing invites disputes, creates budget surprises, and forces your team into endless renegotiation cycles. This article teaches a systematic alternative: lock specifications with measurable tolerances, request method-ID evidence from suppliers, normalize every offer to the same delivery basis, and validate the final number against driver-based benchmarks. The result is a defensible decision that stands up to scrutiny from procurement, finance, and operations—and saves you from the haggling trap.
The Problem: Price-Only Quotes Are Apples vs Oranges
Most RFQs ask for “kraft paper, 120 GSM, brown, unbleached” with a target price. Suppliers respond with figures ranging from $650 to $850 per metric ton, and the buyer defaults to awarding the lowest number. Three months later, the first shipment arrives off-spec, the converting line stops, and the “savings” evaporate in claims, rework, and emergency re-sourcing.
The fundamental issue isn’t dishonesty—it’s misalignment. Buyers and suppliers are comparing prices for subtly different products, shipping terms, and cost structures.
Where Mismatches Creep In
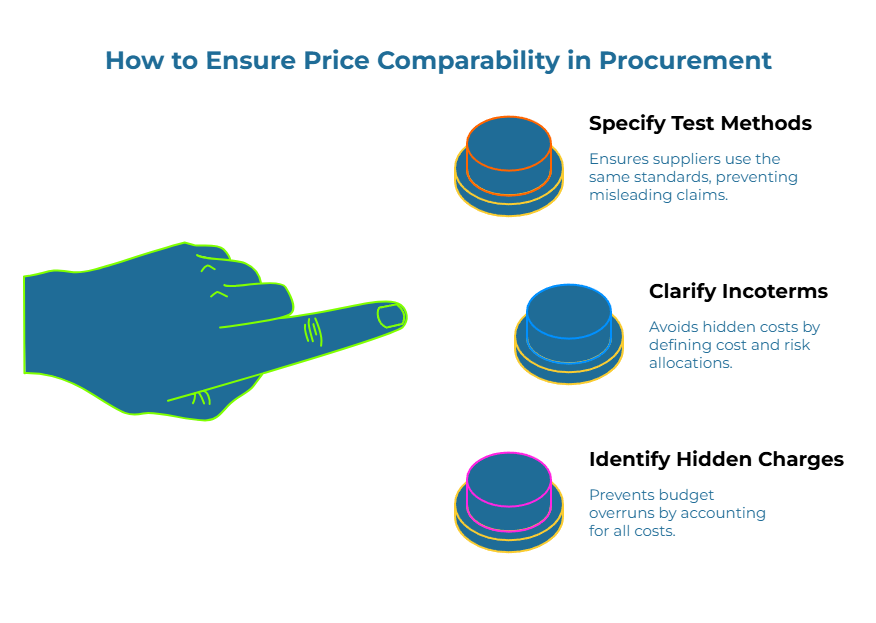
Spec drift is the silent killer of price comparability. One supplier interprets “120 GSM” as 120 ± 3 g/m², while another ships 120 ± 6 g/m². At the low end of the second supplier’s range, you’re getting 114 GSM—a 5% yield penalty that wipes out any quoted savings. Moisture is even more volatile: a mill holding 7% moisture delivers noticeably more usable fiber than one shipping at 9%, but both claim to meet “standard moisture content.”
Burst strength, Cobb value, and tensile indices all suffer from the same problem. Unless your RFQ specifies the test method (ISO 2758 vs TAPPI T 403 for burst, for instance), suppliers can quote based on whichever protocol makes their product look strongest. The buyer ends up evaluating fundamentally incomparable claims.
Incoterms confusion compounds the chaos. An EXW quote looks cheaper on paper, but it shifts all freight, insurance, export documentation, and risk onto the buyer. A CIF quote appears expensive until you realize it includes ocean freight and insurance—then it might be the better deal. Comparing EXW against CIF without converting both to the same delivery basis is financial guesswork, not procurement. The Incoterms® 2020 rules published by the International Chamber of Commerce define these cost and risk allocations precisely, making them the standard reference for eliminating ambiguity in international trade.
Hidden local charges emerge after the contract is signed. Port fees, customs clearance, inland haulage, and storage costs can add 10–15% to a “landed” CIF price. If your RFQ didn’t clarify who pays these, your budget takes the hit.
The buyer who awards based on price alone is essentially running a lottery. The supplier with the loosest tolerances, the most optimistic Incoterms interpretation, or the highest hidden costs often wins—until reality arrives at the warehouse.
What Buyers and Suppliers Both Gain
Before diving into the framework, it’s worth clarifying why this approach benefits both sides of the transaction—not just one.
For buyers (procurement and quality teams):
A single, non-negotiable specification and one to-door delivery basis prevent hidden costs from surfacing after the contract is signed. Evidence-first quotes reduce incoming quality complaints, returns, and the operational chaos that follows off-spec deliveries. Normalized comparisons reveal true best value rather than the noisiest price, allowing you to award contracts with confidence that finance, operations, and quality teams will support.
For suppliers (mills and trading companies):
One clear specification saves substantial time by eliminating back-and-forth clarifications about what the buyer actually needs. Evidence-first requirements reward mills that invest in process control and testing infrastructure, giving them a competitive advantage over suppliers who rely on vague promises. Normalized comparisons reduce “price only” pressure when logistics factors differ, allowing suppliers with superior service or reliability to compete on total value rather than being undercut by artificially low quotes that don’t reflect true delivered cost.
This alignment of incentives is why spec-true, evidence-first sourcing tends to produce longer-term relationships with fewer disputes on both sides.
Spec-True RFQs: Freeze What Changes the Price
A spec-true RFQ eliminates ambiguity by defining exactly what “120 GSM kraft paper” means in measurable, testable terms. It specifies the test methods, the acceptance windows, and the consequences of non-conformance before any supplier quotes. This shifts the conversation from “what’s your best price?” to “what’s your price for this exact specification?”
Required Fields and Tolerances
Your RFQ must lock down the properties that directly affect converting performance and effective cost:
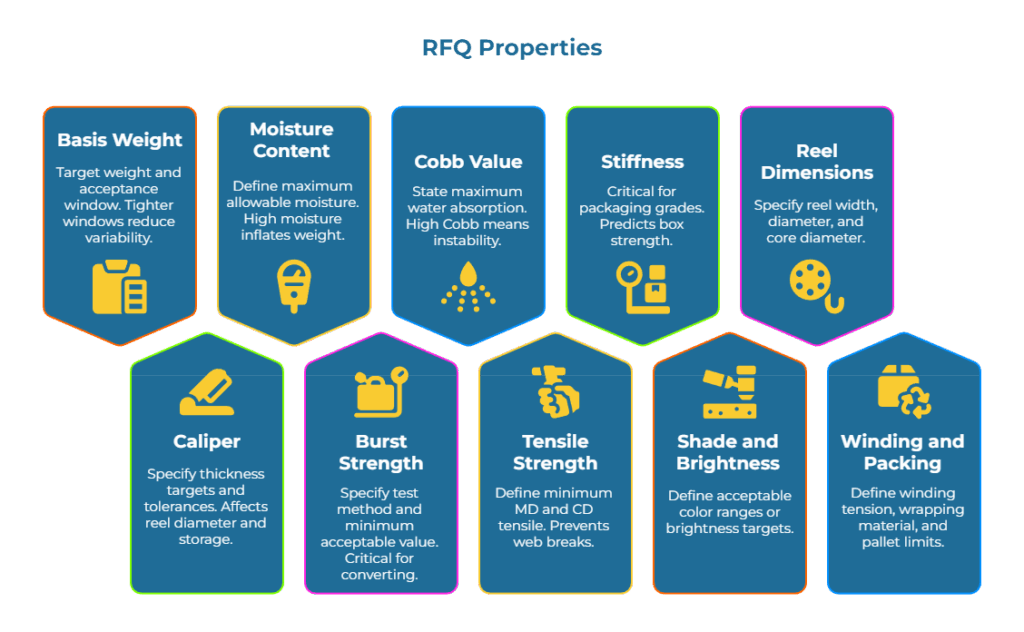
- Basis weight using ISO 536: State the target (e.g., 120 g/m²) and the acceptance window (e.g., ±2 g/m²). Tighter windows cost more but reduce yield variability.
- Caliper (thickness): For grades where bulk matters, specify caliper targets and tolerances. This affects reel diameter, storage, and some converting processes.
- Moisture content per ISO 287: Define the maximum allowable moisture (e.g., ≤8%) and clarify whether this is tested at the mill or upon arrival. High moisture inflates the weight you’re paying for but reduces the fiber you can use.
- Burst strength via ISO 2758 or TAPPI T 403: Specify which method and the minimum acceptable value (e.g., ≥350 kPa). If your converting process stresses the sheet, this isn’t negotiable.
- Cobb value measured by ISO 535: State the maximum water absorption (e.g., ≤45 g/m²) if your end-use involves moisture exposure. High Cobb means instability during printing or coating.
- Tensile strength and TEA using ISO 1924-2: Define the minimum machine-direction (MD) and cross-direction (CD) tensile to prevent web breaks on your line. For grades that must absorb impact or flexing, specify Tensile Energy Absorption (TEA) as well.
- Stiffness or short-span compression via ISO 9895 (SCT): Critical for packaging grades, particularly if the paper feeds into corrugated board production, where compression performance predicts box strength.
- Shade and brightness: For grades where appearance matters (printing, premium packaging), define acceptable color ranges or brightness targets per standard measurement protocols.
- Reel or folio dimensions: Specify reel width, diameter, folio sheet size, core diameter, and any restrictions on splices per reel.
- Winding, packing, and palletization: Define winding tension or hardness if relevant, wrapping material, pallet height and weight limits, core integrity requirements, and labeling details (grade identification, lot numbers, handling symbols).
Each specification should include the test method number, the target value, the tolerance, and whether the mill tests every reel or uses a sampling plan per ISO 186. Don’t assume “industry standard” means the same thing to every supplier.
Acceptance windows and pass/fail logic need explicit rules. Will you accept a shipment if 5% of reels fall outside the tolerance? Or is this a zero-defect requirement? Define your Acceptable Quality Level (AQL) upfront. For example, you might set AQL 1.0 for critical specs like burst and moisture, meaning you’ll tolerate very few defects, and AQL 4.0 for cosmetic issues like minor surface blemishes.
Retention samples are the insurance policy. Require the supplier to seal and label samples from each production lot, with your QA team doing the same upon receipt. If a dispute arises three months later, you both test the sealed samples using the same method. This eliminates “he said, she said” arguments over whether the paper was in-spec at the mill.
For practical guidance on qualifying suppliers and verifying their capability to meet these specs consistently, see our detailed framework on kraft paper supplier pre-qualification and onboarding.
The RFQ Data Pack: What to Send and What to Request
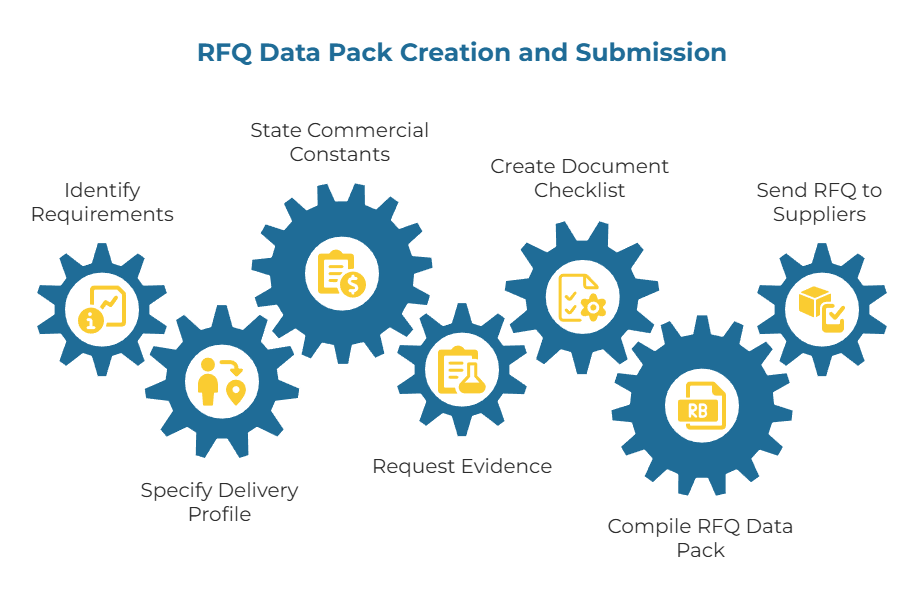
To streamline evidence collection and ensure all suppliers price the same commercial reality, create a comprehensive RFQ Data Pack that you send with every request for quotation. This packet should include:
Your requirements (what you send):
- One-page specification sheet: Grade name, basis weight with tolerance, caliper (if applicable), moisture limit, burst/tensile/Cobb/SCT requirements, shade or brightness, reel or folio dimensions, core specifications, winding parameters, wrapping and packing requirements, palletization standards, and labeling details.
- Annualized volume and call-off pattern: Provide a monthly forecast showing expected volumes, typical release sizes (e.g., 20 MT per release), and flexibility bands (e.g., ±15% month-to-month variation). This helps suppliers understand capacity requirements and production planning.
- Delivery profile: Specify to-door destination(s), acceptable delivery windows, unloading constraints (dock hours, equipment limitations, advance notice requirements), and any special handling or storage needs.
- Commercial constants: State the currency for quotation, payment terms (e.g., Net 30, Net 60, LC at sight), and the Incoterms® 2020 rule you want quoted (or instruct suppliers to price EXW for later normalization).
- Evidence requirements: Grant permission for suppliers to submit recent third-party lab data or state your willingness to conduct sampling against recognized methods. Specify your sampling plan for disputes (e.g., following ISO 186 for lot sampling).
- Document checklist: Request a Certificate of Analysis (COA) template showing which properties the supplier routinely tests, a mill capability statement (capacity, certifications, quality systems), recent customer references (with permission to contact), and an outline of the supplier’s insurance and claims process.
What suppliers must attach (evidence-first quotes):
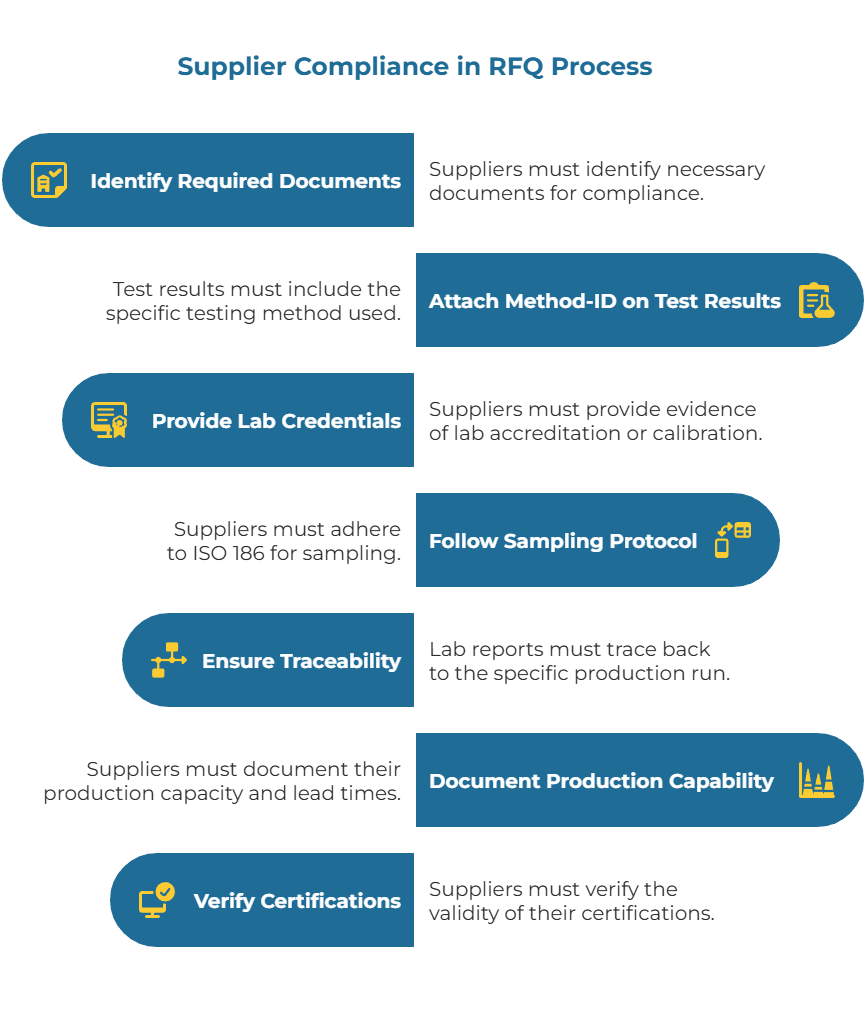
Method-ID on every test result is non-negotiable. When a supplier states “burst strength: 370 kPa,” the lab report must identify whether they used ISO 2758, TAPPI T 403, or some other protocol. Different methods yield different numbers for the same paper, so you need to verify apples-to-apples comparison. The report should also show the test date, the sample ID, and the operator’s signature.
Lab credentials and calibration windows prove the supplier’s testing is trustworthy. Ask for evidence of ISO/IEC 17025 accreditation if the supplier uses an external lab, or request the internal lab’s calibration logs if they test in-house. Equipment like burst testers and tensile machines drift over time; a supplier who can’t show recent calibration is quoting based on potentially inaccurate data.
Sampling protocol per ISO 186 ensures the test results represent the full production batch, not just the best reel. The RFQ should require suppliers to state how many samples they pull per lot (e.g., 3 reels per 20-ton batch) and where in the reel they extract the test specimens (inner wraps vs. outer wraps can behave differently).
Traceability from mill to quote means the lab report must tie back to the specific grade and production run the supplier is offering. A generic “our kraft paper typically achieves 360 kPa burst” won’t cut it. You need a CoA (Certificate of Analysis) or mill test report for the actual product grade in your RFQ.
Production capability documentation should confirm the supplier’s monthly capacity, minimum and maximum order quantities, and typical lead times. This prevents awarding a contract to a supplier who can’t scale to meet your volume needs.
Active certifications with verified scope: Request FSC/PEFC certificates and verify via the official registries that the certificate is active and the scope covers the quoted grade. Learn more about kraft paper manufacturer certifications.
For suppliers, here’s a short copy-block you can adapt and paste into your quotes to signal your evidence-first approach:
Quality Assurance Statement: All quoted specifications are verified via [ISO 536 / ISO 287 / ISO 2758] testing, performed by [Lab Name], last calibrated [Date]. Sampling follows ISO 186; we test [X] reels per [Y]-ton batch. Full mill test reports and certification scope are attached. We retain sealed samples for 90 days for third-party verification if required.
This reassures buyers that you’re not just promising specs—you’re proving them.
Normalize to One To-Door Basis Before Judging Price
Once you have spec-true, evidence-backed quotes, the next step is converting every offer to the same cost basis: your receiving dock. Until you do this, price comparison is still distorted by Incoterms.
Map Responsibilities and Add Missing Costs
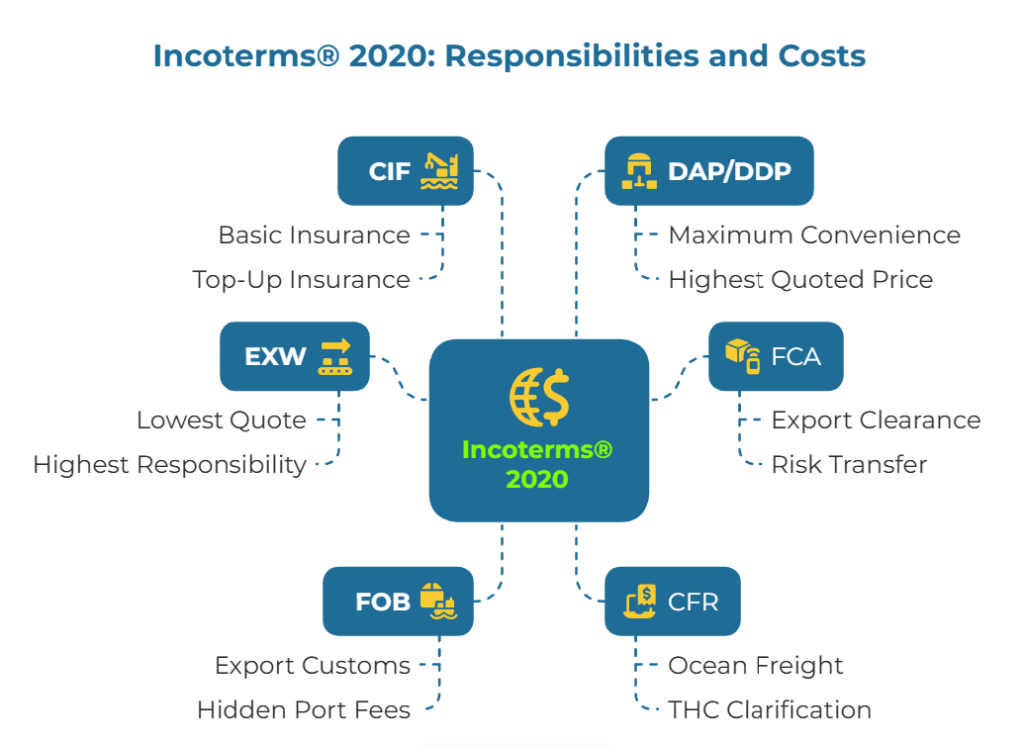
Each Incoterms® 2020 rule defines who pays for what. Here’s how the common terms for containerized kraft paper break down:
- EXW (Ex Works): The supplier makes the goods available at their mill. You arrange and pay for everything: inland transport to the port, export customs, ocean freight, insurance, import customs, duties, port fees, and delivery to your door. The quote is the lowest number you’ll see, but your responsibility—and cost—is the highest.
- FCA (Free Carrier): The supplier delivers the goods to your nominated carrier (often a freight forwarder at the mill’s local terminal). The supplier handles export clearance, but you pay for all transportation and insurance after the handover point. FCA is popular for container shipments because it clarifies risk transfer cleanly.
- FOB (Free On Board): The supplier loads the goods onto the vessel at the origin port and clears export customs. You pay for ocean freight, insurance, import duties, port charges, and inland delivery. FOB is common in paper trade, but buyers often underestimate the hidden port fees.
- CFR (Cost and Freight): The supplier pays ocean freight to your destination port and handles export clearance, but you pay for insurance, import duties, port charges, and inland haulage. This splits responsibilities in a way that can obscure true cost unless you clarify who covers THC (Terminal Handling Charges) and other port fees.
- CIF (Cost, Insurance, and Freight): The supplier pays ocean freight and basic marine insurance to the destination port, plus export clearance. You still pay import duties, port fees, and inland delivery. CIF looks like a full package, but the devil is in the “basic” insurance—it often covers only 110% of the invoice value under minimal conditions. If you want comprehensive coverage, you may need to buy top-up insurance.
- DAP (Delivered at Place) or DDP (Delivered Duty Paid): The supplier handles nearly everything, delivering to your named location. DAP stops short of import duties (you pay those), while DDP includes duties. These terms offer maximum convenience but the highest quoted price—though the actual total cost may be competitive once you account for all the freight and admin you didn’t have to manage.
For detailed guidance on how these terms affect your procurement decisions, see the U.S. International Trade Administration’s Incoterms guide and our article on incoterms for kraft paper buyers: EXW vs FOB vs CIF vs DDP and what changes in your total cost.
To normalize quotes, create a simple worksheet with one column per offer and rows for:
- Quoted price per MT (in USD or your target currency).
- Ocean freight (if not included).
- Marine insurance (if not included).
- Import duties and taxes.
- Port fees (THC, documentation, inspection).
- Inland haulage to your door.
- Total cost to door per MT.
Convert all currencies to a single baseline (e.g., USD) using the same exchange rate and date to eliminate FX noise.
Worked Example: Converting Mixed Incoterms to One To-Door Total
Let’s illustrate with three hypothetical kraft paper quotes for 100 MT, destination Chicago, USA:
- Supplier A: $680/MT EXW (mill in Brazil)
- Supplier B: $720/MT FOB Santos, Brazil
- Supplier C: $750/MT CIF Chicago
Assume illustrative freight and local charges:
| Cost Element | Supplier A (EXW) | Supplier B (FOB) | Supplier C (CIF) |
| Base Quote per MT | $680 | $720 | $750 |
| Export Inland Freight (mill to port) | +$15 | Included | Included |
| Ocean Freight (Santos to Chicago) | +$55 | +$55 | Included |
| Marine Insurance (0.3% of value) | +$2 | +$2 | Included |
| Import Duty (assume 3%) | +$23 | +$23 | +$23 |
| Port Fees (THC, handling, docs) | +$20 | +$20 | +$20 |
| Inland Delivery (port to Chicago door) | +$25 | +$25 | +$25 |
| Total Cost to Door per MT | $820 | $845 | $818 |
Suddenly, Supplier C’s $750 CIF quote—the “most expensive”—is actually the cheapest on a to-door basis. Supplier A’s $680 EXW quote, which looked like a bargain, is the most expensive once you account for all the responsibilities you must handle.
This exercise reveals the true economic comparison. If you’d awarded based on quoted price alone, you’d have chosen the wrong supplier and blown your budget by $27,000 on a 100 MT order.
For more detail on building this normalization framework, see the landed-cost framework for kraft paper: from incoterms to to-door comparability and comparing quotes across incoterms: a practical normalization method for true to-door decisions.
When Freight Flips the Winner
Ocean freight is volatile. Container rates can spike 30–50% during peak season or when a carrier imposes a General Rate Increase (GRI) or Peak Season Surcharge (PSS). If your normalized quote assumes baseline freight and the market surges before you lock the contract, your winner might change.
Stress-Test with Three Scenarios
Run each normalized quote through three freight scenarios:
- Baseline: Use the current spot rate or the rate your freight forwarder quoted.
- Surge (+30%): Model what happens if ocean freight jumps 30% due to a PSS or capacity crunch.
- Relief (–15%): Model a scenario where rates drop 15% (less common, but possible if you time your shipment during a slack season).
Let’s revisit the earlier example, focusing only on ocean freight impact (all other costs stay constant):
| Scenario | Supplier A EXW | Supplier B FOB | Supplier C CIF |
| Baseline ($55/MT ocean) | $820/MT | $845/MT | $818/MT ← Winner |
| Surge ($72/MT ocean, +30%) | $837/MT | $862/MT | $818/MT ← Still Winner |
| Relief ($47/MT ocean, –15%) | $812/MT | $837/MT | $818/MT ← Still Winner |
In this case, Supplier C holds rank across all freight scenarios because their CIF quote locks in the ocean cost. Suppliers A and B are exposed to freight swings, so their to-door cost fluctuates.
But consider a different set of quotes where Supplier C had quoted CIF at $760 instead of $750. Now:
| Scenario | Supplier A EXW | Supplier B FOB | Supplier C CIF |
| Baseline ($55/MT ocean) | $820/MT | $845/MT | $828/MT ← Supplier A wins |
| Surge ($72/MT ocean, +30%) | $837/MT | $862/MT | $828/MT ← Supplier C wins |
| Relief ($47/MT ocean, –15%) | $812/MT | $837/MT | $828/MT ← Supplier A wins |
The freight stress-test reveals that rank order isn’t stable. If you plan to contract in Q1 for Q3 delivery and you expect a peak season surge, Supplier C becomes the safer choice even though they’re more expensive at baseline.
Visualize these scenarios in a simple bar chart with three clusters (Baseline, Surge, Relief) and three bars per cluster (Supplier A, B, C). This makes the rank flips obvious to stakeholders and helps you decide whether to lock in a CIF offer now or gamble on favorable freight later.
For a deeper dive into how freight volatility affects supplier rankings, see freight scenarios that flip kraft paper supplier rankings: when ocean rates change the winner.
Benchmark vs Quote: A 3-Step Sanity Check
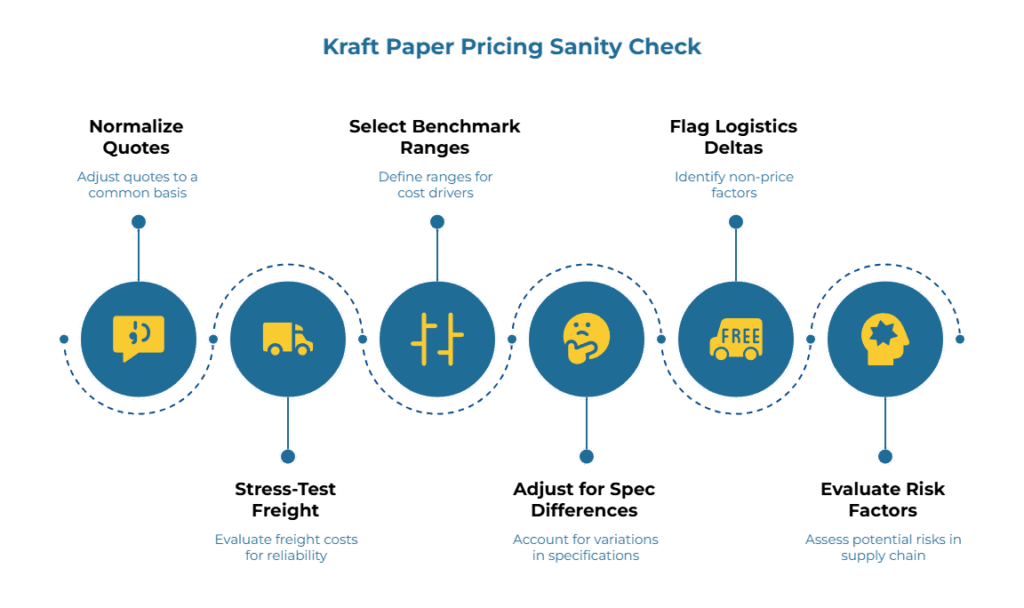
You’ve normalized quotes to the same to-door basis and stress-tested freight. The final step is validating that the winning quote is reasonable relative to the market’s cost drivers. This isn’t about finding the “market price”—it’s about confirming your supplier isn’t wildly overpriced or suspiciously underpriced (which often signals hidden quality or delivery risk).
Kraft paper pricing is driven by five main factors: fiber cost (the pulp or recovered fiber the mill buys), energy cost (fuel and electricity for pulping and drying), freight cost (the ocean and inland logistics you’ve already modeled), foreign exchange (the currency relationship between the supplier’s country and yours), and yield factors (how much usable fiber you actually get from the quoted weight, after accounting for moisture and trim waste).
Step 1: Select Driver-Aligned Benchmark Ranges
Rather than chasing a single “market price,” define a range for each driver based on publicly available indices or your own historical data:
- Fiber cost: Check publicly reported pulp prices from sources like RISI or national forestry statistics. For virgin kraft, softwood pulp prices are a key input. For recycled grades, OCC (Old Corrugated Containers) prices give you a proxy.
- Energy cost: Track regional natural gas or fuel oil prices using sources like U.S. Energy Information Administration data. Mills in energy-intensive regions will pass through higher costs.
- Freight: You’ve already modeled this in your normalization, but cross-check your forwarder’s rates against spot indices like the Freightos Baltic Index to confirm they’re in the ballpark.
- FX: Use mid-market rates from a reliable source like OANDA or central bank data. A 10% currency swing can shift landed costs significantly.
- Yield: If a supplier quotes a high to-door price but delivers consistently tighter moisture (7% vs. 9%) and tighter basis weight tolerances (±2 vs. ±5 g/m²), their effective cost per usable ton might be lower than a “cheap” competitor shipping loose specs.
These ranges create a reality check. If virgin kraft pulp is trading at $800/MT and energy is elevated, a quote that lands you at $750/MT to-door for 120 GSM brown kraft should raise questions: Is the supplier cutting corners on quality? Using off-spec pulp? Or are they simply in a low-cost region with favorable logistics?
Step 2: Adjust for Spec and Yield Differences
Two suppliers quoting “120 GSM kraft” might deliver different effective costs due to moisture, trim waste, and basis weight variation. Use this simple formula to compare effective cost per usable ton:
Effective Cost per Usable MT = (Quoted Price per MT) / [(1 – Moisture %) × (1 – Trim Waste %) × (1 – Basis Weight Variance %)]
For example:
- Supplier X: $750/MT to-door, 8% moisture, 3% trim waste, ±3 g/m² basis weight variance (~2.5% effective loss) → Effective cost = $750 / (0.92 × 0.97 × 0.975) ≈ $862/MT usable.
- Supplier Y: $780/MT to-door, 7% moisture, 2% trim waste, ±2 g/m² variance (~1.7% effective loss) → Effective cost = $780 / (0.93 × 0.98 × 0.983) ≈ $868/MT usable.
Supplier X looks cheaper on paper, but Supplier Y delivers nearly the same effective cost with tighter quality—and likely fewer production interruptions. This adjustment prevents you from chasing low quotes that cost more in the long run.
For a comprehensive guide to these driver-based adjustments, see benchmark vs quote: a practical method to sanity-check supplier kraft paper prices and quality specs vs price: how basis weight, burst, and cobb shape your kraft paper real cost.
Step 3: Flag Logistics Deltas and Risk Factors
Finally, review non-price factors that affect total cost of ownership:
- Lead time: A supplier offering 8-week lead time vs. 12 weeks reduces your working capital tie-up and pipeline inventory risk.
- Port congestion risk: If the supplier ships from a port known for rollovers or delays, budget an extra 1–2 weeks in your delivery plan and factor in potential demurrage charges.
- Payment terms: A supplier offering Net 60 vs. Net 30 improves your cash flow, effectively reducing your cost of capital on that order.
- Track record: If you have historical OTIF (On-Time, In-Full) data for this supplier, a 95% OTIF supplier is worth a premium over a 75% OTIF supplier, even if the quote is slightly higher.
This qualitative layer prevents you from awarding solely on price. A $10/MT cost advantage evaporates if the supplier misses your delivery window and forces a production shutdown.
Practical Examples
To make these principles concrete, here are two common scenarios that illustrate how spec-true RFQs and evidence-first quotes change outcomes:
Example 1: Kraft Linerboard, 170 GSM
Supplier A quotes CIF at $825/MT and looks 2% cheaper than Supplier B’s EXW quote of $780/MT. After normalizing by adding inland drayage ($22/MT), customs ($25/MT), and last-mile haul ($28/MT) to Supplier B’s quote, Supplier B’s to-door total becomes $855/MT—meaning Supplier A is actually 3.5% cheaper. However, Supplier A’s recent CoA shows moisture at 8.5%, while Supplier B consistently holds 7.2% per ISO 287 testing. After adjusting for effective usable weight, Supplier B delivers lower cost per usable ton and causes fewer converting line jams due to dimensional instability. Awarding to Supplier B based on evidence-first evaluation prevents future operational disruptions.
Example 2: MG Kraft, 40 GSM
Supplier C matches the lowest quoted price but lacks recent tensile strength data in their submission. Rather than awarding on price alone or rejecting the quote outright, the buyer requests a 48-hour sample test to ISO 1924-2. The test confirms performance meets the required 2.8 kN/m MD tensile, the quote stays in contention, and both parties avoid a future dispute over whether the grade was suitable. The small delay for sampling eliminates the risk of a much larger problem: awarding a contract to a supplier whose product fails on the converting line three months later.
These examples illustrate common outcomes; exact results depend on routes, market conditions, and grade-specific behavior.
When You Should Haggle (And When You Shouldn’t)
Negotiation has its place, but timing matters. Haggling is productive only after you’ve confirmed three conditions:
- The offer meets spec: The supplier’s evidence pack demonstrates they can deliver the exact specification you defined, with acceptable tolerances and test method alignment.
- The quote is normalized: You’ve converted the offer to the same to-door basis as competing quotes, so you’re comparing true delivered cost rather than distorted unit prices.
- Evidence shows consistent delivery capability: The supplier’s track record (OTIF performance, customer references, production capacity) confirms they can execute reliably over time.
Before these conditions are met, “negotiation” often just moves numbers around with no change in actual value. A supplier who drops their price 5% without changing the spec might simply be agreeing to ship looser tolerances or slower delivery—which costs you more downstream.
After normalization and evidence validation, negotiate on what actually matters: lead time improvements, payment term flexibility, volume discounts for committed orders, or service enhancements like vendor-managed inventory. These discussions create real value because they’re grounded in comparable, defensible numbers.
Objections and Answers
Buyer Objections
“This process seems too complicated for routine reorders. Can’t I just use last year’s supplier at last year’s price?”
Repeating last year’s order without refreshing the spec and evidence check is procurement inertia, not strategy. Pulp prices, energy costs, and freight rates shift constantly; a supplier who was competitive 12 months ago might be 15% overpriced today—or they might have tightened their quality systems and now offer better value. Re-running a spec-true RFQ every 6–12 months takes a few extra hours but protects you from locked-in inefficiency. If you’re confident your incumbent still offers the best value, the process will confirm it. If not, you’ll catch the problem before it becomes a budget crisis.
“Suppliers push back when I ask for detailed lab reports. They say it’s proprietary or too much admin.”
A supplier who won’t share method-ID test data is essentially saying “trust me” without proof. In industries where a 2% moisture difference translates to tens of thousands of dollars in yield loss, blind trust is expensive. Frame the request as mutual protection: you both avoid disputes if there’s a clear record of what was promised and what was delivered. Offer to sign an NDA if the supplier is concerned about competitors seeing their process capability data. Most reputable mills already generate these reports for internal QA; attaching them to a quote is a five-minute task, not a burden. If a supplier still refuses, it’s a signal about transparency—and you should weigh that risk accordingly.
“CIF quotes always seem more expensive. Why not just take the cheapest EXW quote and handle freight myself?”
CIF quotes look expensive because the supplier is doing the work—and bearing the risk—of getting the goods to your port. When you take an EXW quote and arrange freight yourself, you inherit the risk of booking errors, rollovers, carrier surcharges, and documentation delays. If you have an experienced logistics team and strong freight forwarder relationships, handling it yourself can save money. But for most small-to-midsize buyers, the hidden costs (admin time, demurrage risk, customs penalties for wrong paperwork) often exceed the “savings” from a low EXW price. Run the full to-door normalization and stress-test before concluding that EXW is cheaper.
Supplier Objections
“Buyers are asking for too much documentation. We don’t have time to compile all this for every RFQ.”
Evidence-first quoting actually saves you time in the long run. When you provide method-ID test reports upfront, you prevent the back-and-forth of “can you clarify your specs?” and “how did you test this?” that drags out negotiations. You also drastically reduce post-delivery disputes. A claim over off-spec moisture becomes a 10-minute comparison of sealed samples against the CoA you sent, not a weeks-long argument. Build a standard RFQ response template that includes your typical test reports, certifications, and sampling plan. Once you’ve done it for one customer, it’s 90% reusable for the next. Buyers who demand evidence are serious about quality and long-term relationships—these are the customers who pay on time and reorder predictably.
“If we quote CIF and freight spikes before the shipment, we lose money. Why should we take that risk?”
You’re right that CIF locks you into freight risk. But CIF also commands a price premium precisely because you’re offering certainty to the buyer. If you’re uncomfortable with freight exposure, offer both CIF and FOB quotes. The FOB quote puts freight risk back on the buyer, while the CIF quote shows your “all-in” offer. Many buyers will pay 2–3% more for CIF just to avoid managing logistics themselves, especially if they’re sourcing internationally for the first time. Alternatively, negotiate a freight escalation clause: quote CIF at today’s freight rate, but reserve the right to adjust if ocean freight moves more than ±X% before the bill of lading date. Sophisticated buyers understand this and will accept it if you’re transparent upfront.
“The buyer’s specs say ‘±2 g/m²’ but our mill realistically holds ±5 g/m². Should we just quote anyway and hope they don’t notice?”
No. Quoting outside your actual process capability is a fast path to claims, reputational damage, and lost future business. If your mill can’t hold ±2 g/m², say so in your quote and explain why: “Our standard process capability for this grade is ±5 g/m², which reflects industry norms for this fiber blend. We can achieve ±3 g/m² with additional quality controls, though this increases cost by approximately $X/MT. If ±2 g/m² is essential, we can explore a trial run, but we recommend evaluating whether the tighter tolerance genuinely impacts your converting process.” Buyers respect honesty. If they truly need ±2 g/m², you’ve avoided a doomed relationship. If they’re flexible, you’ve opened a negotiation. Either way, you’re not setting yourself up for failure.
One-Page Playbook and Acceptance Criteria
To make this workflow practical, distill it into a single-page playbook your procurement, QA, and finance teams can reference during every sourcing cycle.
Spec-True RFQ Playbook
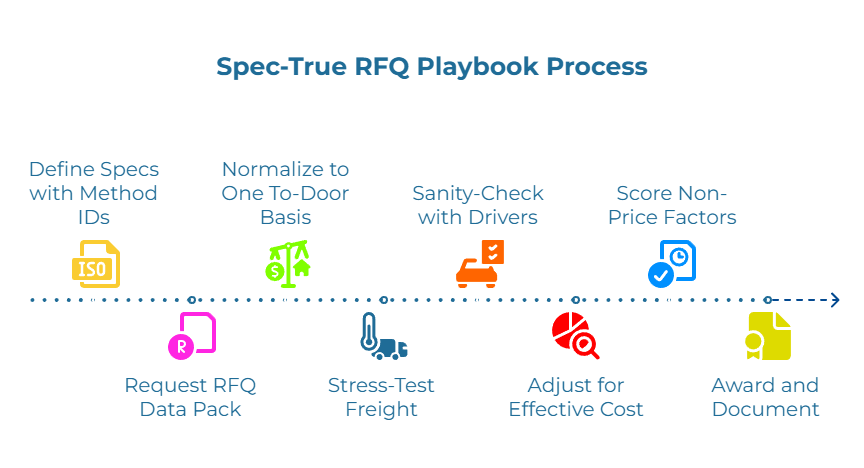
- Define Specs with Method IDs: Basis weight (ISO 536), moisture (ISO 287), burst (ISO 2758 or TAPPI T 403), Cobb (ISO 535), tensile (ISO 1924-2), SCT (ISO 9895). Add caliper, TEA, stiffness, shade/brightness, and packing details (reel dimensions, core, wrapping, palletization, labeling) where relevant. Include target, tolerance, and AQL.
- Request the RFQ Data Pack: Product declaration, test reports with method IDs, sampling plan per ISO 186, lab credentials, certification scope, production capability, annualized volume and call-off patterns, delivery profile with unloading constraints, commercial constants (currency, payment terms, Incoterms® 2020 term + place), COA template, mill capability statement, customer references, and insurance/claims process outline.
- Normalize to One To-Door Basis: Build a worksheet adding all missing costs (freight, insurance, duties, port fees, inland delivery). Convert all quotes to the same delivery point in the same currency.
- Stress-Test Freight: Model baseline, +30% surge, and –15% relief scenarios. Confirm your winner holds rank across plausible freight changes.
- Sanity-Check with Drivers: Compare to-door total against fiber/energy/freight/FX/yield benchmarks. Flag quotes >10% above or below expected range for deeper review.
- Adjust for Effective Cost: Calculate effective cost per usable ton, factoring in moisture, trim waste, and basis weight variance.
- Score Non-Price Factors: Assess lead time, OTIF track record, payment terms, port congestion risk. A 5% price advantage isn’t worth a 15% OTIF failure rate.
- Award and Document: Select the supplier with the best effective to-door cost, robust freight stability, and acceptable non-price risk. Archive the normalization worksheet, stress-test results, and evidence pack for audit.
Acceptance Criteria That Eliminate Disputes
State the pass/fail gates upfront to prevent ambiguity later:
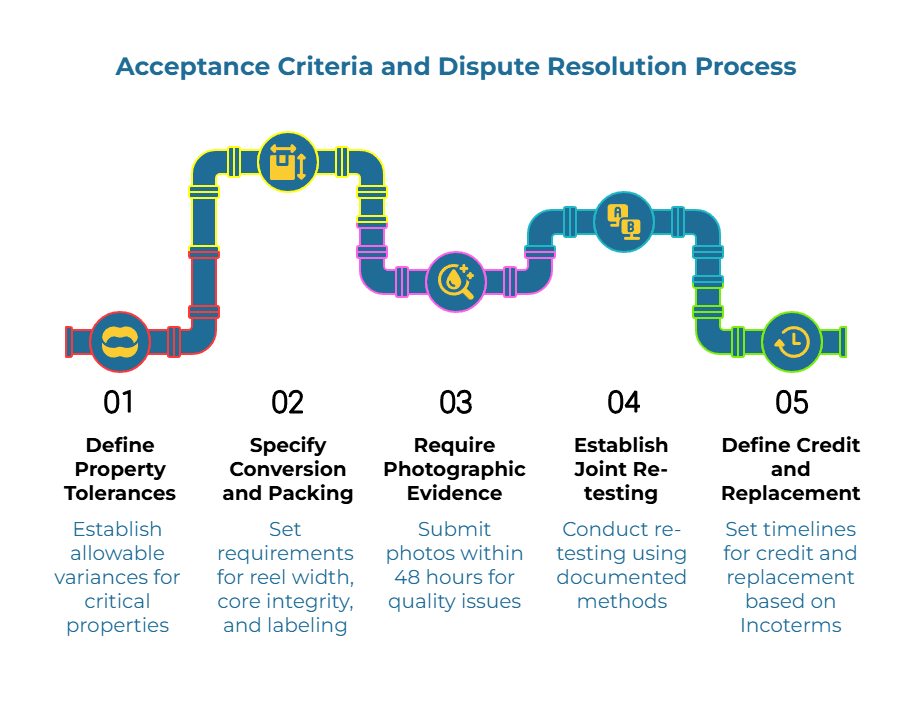
- Property tolerances: Define allowable variance on basis weight, moisture, Cobb, tensile, compression, and other critical properties. Specify how many samples will be tested, which method defines pass/fail (referencing ISO or TAPPI standards), and what constitutes a lot or batch for sampling purposes.
- Conversion and packing specifications: Reel width tolerance, core integrity requirements (no crushing, proper winding tension), wrapping material and condition, pallet height and weight limits, and labeling details (grade name, lot number, production date, mill identifier, handling symbols).
- Claims and rework process: Require photographic evidence to be submitted within 48 hours of receipt if a quality issue is suspected. Establish a joint re-testing process where both parties test retained samples using the same method that was documented in the original CoA. Define credit and replacement timelines that align with the Incoterms rule used—under CIF or DDP, for example, the supplier typically bears more responsibility for arranging replacement shipments than under EXW.
These measurable gates and defined procedures, combined with clear Incoterms allocation of risk, prevent the “he said, she said” disputes that consume weeks of admin time and damage business relationships.
KPIs to Track Success
Measure whether this process actually improves outcomes:
- % Quotes Normalized: Target 100% of RFQs above a certain value threshold (e.g., $50k+) should go through full to-door normalization.
- Dispute Rate: Track claims per 100 MT purchased. If spec-true RFQs and evidence-first quotes are working, disputes should drop by 30–50% within 12 months.
- OTIF Impact: Measure On-Time, In-Full delivery performance by supplier. Suppliers selected via evidence-first criteria should achieve >90% OTIF vs. 70–80% for suppliers selected on price alone.
- Award Cycle Time: The first time you run this process, it may take 2–3 weeks. After 3–4 cycles, target <5 days from RFQ close to award decision, because the framework eliminates haggling loops.
When procurement, finance, and operations all trust that the awarded supplier delivers predictable quality at a validated cost, you’ve eliminated the noise. Price becomes a meaningful signal, not just a number.
For a comprehensive approach to integrating manufacturer evidence with exporter reliability data, see integration playbook: how manufacturer evidence + exporter reliability de-risk international kraft paper supply and the price-to-door playbook: integrating driver-based benchmarks with a landed-cost framework for defensible supplier selection.
Frequently Asked Questions
How do I compare EXW vs CIF fairly?
Build a normalization worksheet that adds all missing costs to each quote until both reach the same delivery point—your receiving dock. For EXW, add export inland freight, ocean freight, insurance, duties, port fees, and inland delivery. For CIF, add duties, port fees, and inland delivery (the supplier already covered freight and insurance). Convert both to the same currency using the same exchange rate. The resulting “to-door” totals are now directly comparable. Always stress-test with +30% and –15% freight scenarios to confirm the winner stays stable.
What belongs in a spec-true kraft paper RFQ?
A spec-true RFQ must define every property that affects converting performance and cost using standardized test methods. Include basis weight per ISO 536 with tolerance (e.g., 120 ± 2 g/m²), moisture per ISO 287 with maximum limit (e.g., ≤8%), burst strength via ISO 2758 or TAPPI T 403 with minimum value (e.g., ≥350 kPa), Cobb value per ISO 535 (e.g., ≤45 g/m²), tensile strength per ISO 1924-2 for MD and CD, and SCT via ISO 9895 if relevant. For specific grades, add caliper, TEA, stiffness, and shade/brightness requirements. Also specify your AQL for each property, retention sample requirements, reel or folio dimensions, packing and palletization standards, and exact Incoterms® 2020 term with named place. Finally, require suppliers to attach the RFQ Data Pack: test reports with method IDs, sampling plan per ISO 186, lab credentials, certification scope, production capability statement, and customer references.
What is method-ID evidence and why ask for it?
Method-ID evidence means the supplier’s test report identifies which specific standard they used to measure each property—for example, ISO 2758 vs. TAPPI T 403 for burst strength. Different test methods can produce different numbers for the same paper, so without method-ID transparency, you can’t verify that quotes are comparable. Asking for method-ID evidence also confirms the supplier actually tests their product rather than guessing or using outdated data. It protects both parties: if a dispute arises, you both retest sealed retention samples using the same method that was documented in the original quote, eliminating “he said, she said” arguments.
How can freight changes flip my winner?
Ocean freight is volatile and can swing 30–50% due to Peak Season Surcharges (PSS), General Rate Increases (GRI), or capacity crunches. If your normalized quote assumes baseline freight rates but the market surges before shipment, a supplier who quoted FOB or EXW (where you pay freight) suddenly becomes more expensive, while a supplier who quoted CIF (where they locked in the freight cost) stays stable. Running three scenarios—baseline, +30% surge, and –15% relief—reveals whether your chosen supplier holds rank across plausible freight changes. If the rankings flip under surge conditions and you expect peak season pressure, you might choose a slightly more expensive CIF offer for certainty rather than gambling on favorable freight.
Which KPIs prove this process works?
Track four key metrics: (1) % quotes normalized—aim for 100% of RFQs above your value threshold (e.g., $50k+) going through full to-door normalization; (2) dispute rate—measure claims per 100 MT purchased, targeting a 30–50% reduction within 12 months as spec-true RFQs and evidence-first quotes eliminate ambiguity; (3) OTIF impact—suppliers selected via evidence-first criteria should achieve >90% On-Time, In-Full delivery vs. 70–80% for price-only selections; (4) award cycle time—after 3–4 cycles, target <5 days from RFQ close to award decision because the framework eliminates haggling loops. When these metrics improve, procurement, finance, and operations all gain confidence that the awarded supplier will deliver predictable quality at a validated cost.
Can suppliers quote alternatives to the spec-true base requirement?
Yes, but only after they provide a compliant base quote. Alternatives should clearly list exactly what changes (e.g., different reel width, modified packing, alternative grade with similar performance), provide matching method-ID evidence for the new specification, and explain the value trade-off (faster delivery, lower cost, better availability). This allows buyers to evaluate options without losing the baseline comparability that makes the spec-true framework effective.
Ready to Source Smarter?
Price without context is noise. A $680 EXW quote isn’t cheaper than a $750 CIF offer until you’ve normalized both to the same to-door total, stress-tested freight scenarios, and adjusted for effective yield. Spec-true RFQs eliminate ambiguity by locking measurable tolerances and test methods before suppliers quote. Evidence-first quotes give you proof—method-ID lab reports, sampling plans, and certification scope—that a supplier can actually deliver what they promise. Driver-based benchmarks provide the final sanity check, confirming your winner is reasonable relative to fiber, energy, freight, and FX realities.
The result: defensible decisions that stand up to scrutiny from procurement, finance, and operations. You spend less time haggling and more time building relationships with suppliers who deliver consistent quality at predictable cost. Your dispute rate drops, your OTIF performance improves, and your budget stops getting ambushed by hidden charges or off-spec shipments.
Disclaimer: This article is for educational purposes only. PaperIndex is a neutral, non-transactional B2B marketplace connecting buyers and suppliers in the pulp and paper industry. All negotiations, transactions, and pricing decisions occur directly between buyers and suppliers. The examples, figures, and scenarios presented are illustrative and based on general industry knowledge; actual costs will vary based on specifications, suppliers, market conditions, and logistics arrangements. Buyers and suppliers should verify all information independently and consult with qualified professionals before making sourcing or sales decisions.
For Buyers: Ready to source kraft paper with confidence? Submit your RFQ to connect with verified suppliers who can provide spec-true, evidence-backed quotes, or find suppliers across 8,400+ product categories.
For Suppliers: Want to position your mill as an evidence-first provider? Join PaperIndex free to access 49,000+ global buyers, or contact buyers directly to showcase your quality systems and competitive landed costs.
Our Editorial Process
Our expert team uses AI tools to help organize and structure our initial drafts. Every piece is then extensively rewritten, fact-checked, and enriched with first-hand insights and experiences by expert humans on our Insights Team to ensure accuracy and clarity.
About the PaperIndex Insights Team
The PaperIndex Insights Team is our dedicated engine for synthesizing complex topics into clear, helpful guides. While our content is thoroughly reviewed for clarity and accuracy, it is for informational purposes and should not replace professional advice.