📌 Key Takeaways
Quality variance in kraft paper erodes production margins through waste, downtime, and customer complaints that dwarf any headline price savings.
- Model Contribution Per Hour: Calculate what one machine-hour generates, not just cost per ton, to reveal true supplier impact.
- Hidden Costs Compound Fast: A single bad batch causing 2% extra waste and two hours downtime can erase three deliveries’ worth of savings.
- Moisture Drives Most Problems: Paper’s hygroscopic nature means moisture variation causes curl, jams, and dimensional instability that stops converting lines.
- Process Control Predicts Performance: Suppliers with documented QC, test certificates, and stable moisture management deliver more predictable results than low-price unknowns.
- Align Owner and Ops First: A simple cost-of-downtime scorecard tracking waste, stops, and complaints creates shared decision language between financial and operational priorities.
Cheap paper costs most when machines stop running.
SME paper bag manufacturers and packaging converters balancing tight margins with quality risk will find a practical three-step modeling framework here, preparing them for the detailed cost calculation and supplier evaluation methods that follow.
The quote arrives. Supplier A undercuts your current price by USD 15 per ton.
Standing on the plant floor, you watch the bag-making line run smoothly on yesterday’s stock. The machines hum. Output flows. But your mind drifts to that new supplier, the one promising savings that could pad thin margins. You’ve been here before. The temptation to say yes. The nagging worry about what happens when the first container arrives and the paper doesn’t behave.
This is the deal-breaker moment that every paper bag manufacturer knows too well. The spreadsheet says “savings.” Experience whispers “risk.” And somewhere between those two voices, real money gets made or lost.
If you’ve ever chased a lower price only to watch your machines jam, your waste bins overflow, and your customers complain, this guide will show you exactly where that “saving” disappears. More importantly, it will give you a simple way to test any offer before betting your plant on it.
The Illusion of “Cheap” Paper in a Margin-Sensitive Plant
Most sourcing decisions start the same way: a spreadsheet comparing quotes from three or four suppliers, sorted by price per ton.
Consider a scenario many SME converters recognise. Supplier A offers kraft paper at USD 580 per ton. Supplier B, your current source, holds at USD 595. The maths looks obvious. On a monthly buy of 50 tons, Supplier A saves you USD 750. Over a year, that’s USD 9,000 back in your pocket.
The owner sees working capital relief. The procurement manager sees a win. But the operations manager hesitates. Last time the plant tried an unknown supplier, moisture levels swung batch to batch. Rolls telescoped. The converting line jammed twice a shift for a week.
Here’s the question worth pausing on: what if the paper that looks cheapest is actually the one that costs the most?
Where Quality Variance Actually Shows Up on Your P&L
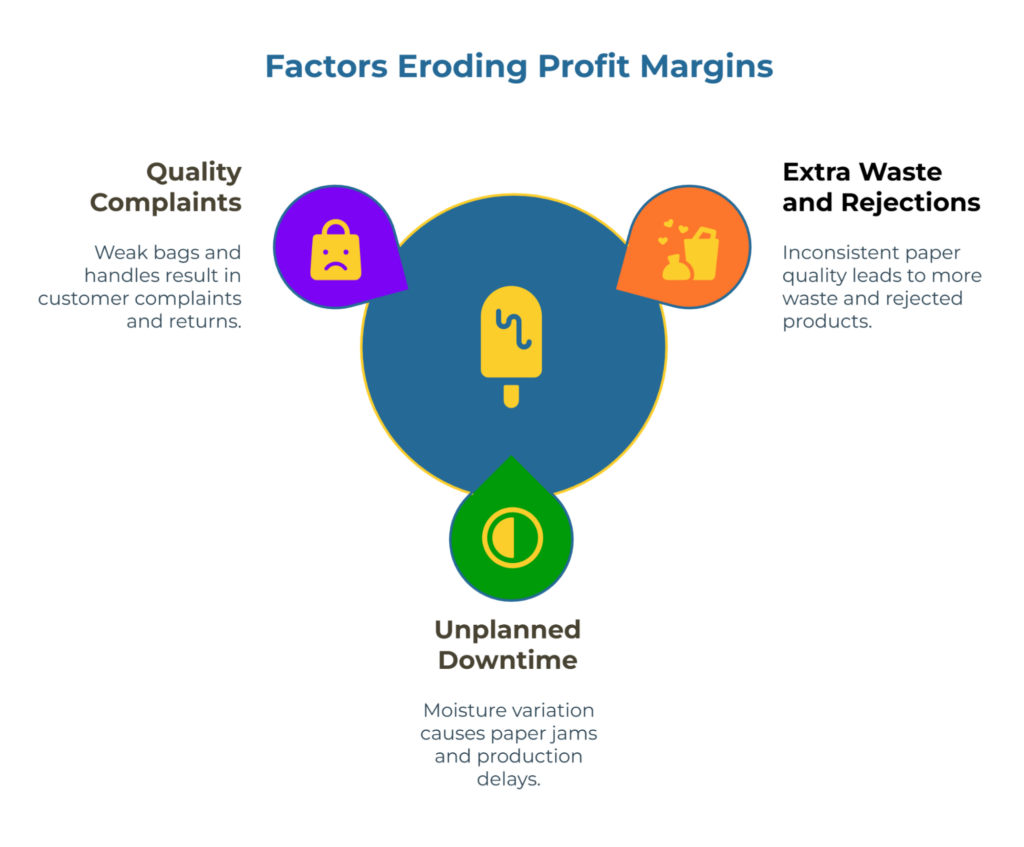
Quality variance erodes margin through three distinct channels that rarely appear together on any single report. Each channel bleeds profit quietly, and together they can overwhelm the headline savings from a lower-priced kraft paper supplier. A total cost of ownership approach reveals where these hidden costs accumulate.
Hidden Cost Bucket #1: Extra Waste and Rejections
When kraft paper arrives with inconsistent basis weight or burst strength below spec, converting lines reject more material. Rolls that should yield 10,000 bags produce 9,700. The difference accumulates quietly.
Paper web breaks are a major runnability problem and a primary cause of lost production time and paper waste, a fact widely recognized across the converting industry. Even a one-percentage-point increase in waste is significant in a high-volume plant. The specific impact will vary by operation, but continuous improvement case studies across manufacturing consistently show that small changes in yield can translate into meaningful profit gains or losses at scale.
Consider an illustrative example: if your plant converts 40 tons of kraft per month at an average contribution margin of USD 200 per ton, a 1% waste increase costs roughly USD 80 in lost output. That single percentage point, repeated month after month, quietly consumes the headline savings that made the cheaper supplier attractive.
Understanding which kraft paper grades match specific bag applications helps prevent waste from spec mismatches.
Hidden Cost Bucket #2: Unplanned Downtime and Speed Losses
Moisture variation causes paper to warp, misfold, or jam. Each stoppage triggers a chain reaction. Operators clear the line. Threading restarts. The first few dozen bags often go to scrap as settings stabilize. Even when waste percentages look acceptable, the hours lost and the slower running speeds strip margin just as effectively.
Unplanned downtime is widely acknowledged across all manufacturing sectors to equate to a significant portion of annual turnover when lost output and associated costs are factored in. Even for smaller converters, the pattern holds: two hours of unplanned downtime on a line contributing USD 150 per hour means USD 300 gone, plus overtime if the shift runs long to recover volume. Multiply by a few bad days per month and the “savings” evaporate.
Hidden Cost Bucket #3: Quality Complaints and Brand Damage
Weak bags tear. Handles pull off. Customers call. What follows is a cascade of credit notes, re-runs, and urgent shipments to replace defective stock. In severe cases, contracts disappear entirely when a retail buyer loses patience.
These costs rarely hit the same line item as raw material purchases, which is precisely why they stay invisible during supplier selection.
How to Model the True Cost of a Bad Batch
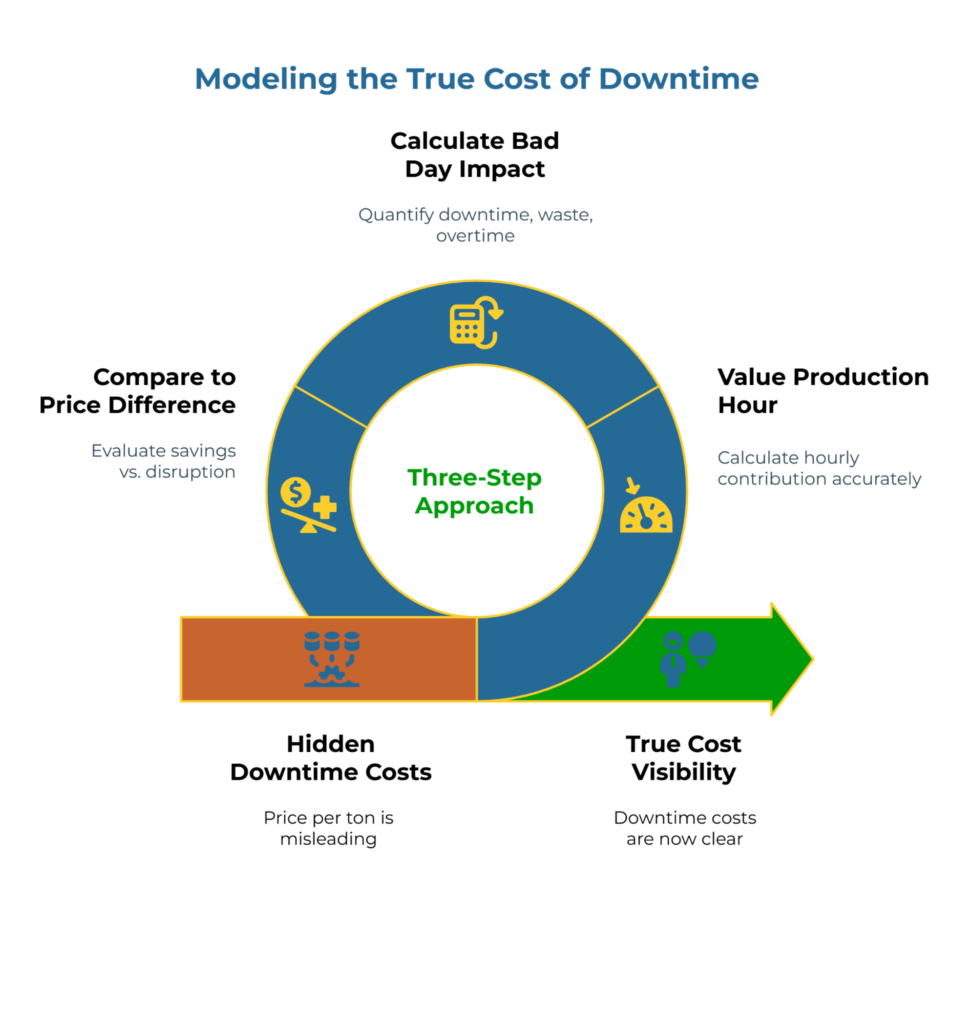
Turning intuition into evidence requires simple maths, not complex software. The following three-step approach gives owners and operations managers a shared language for evaluating any supplier offer.
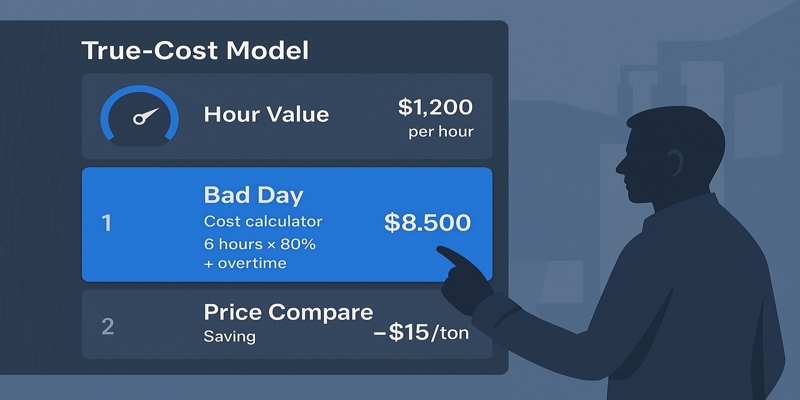
Step 1: Estimate the Value of One Hour of Production
Start with contribution per machine hour rather than cost per ton.
Illustrative formula: Hourly contribution ≈ (average daily output in bags × average contribution per bag) ÷ hours run per day
For example, a plant producing 50,000 bags per day at USD 0.03 contribution each, running 10 hours, generates roughly USD 150 of contribution per hour. Your numbers will differ. The point is to anchor the discussion in what an hour of uptime is actually worth.
The most expensive paper is the one that stops your machine.
Step 2: Calculate the Impact of One “Bad Day”
Now apply realistic disruption. Suppose a batch of inconsistent paper causes two hours of stoppages and pushes waste up by 1.5%, requiring an extra hour of overtime to meet orders.
Using illustrative figures:
- Lost contribution from downtime: 2 hours × USD 150 = USD 300
- Extra waste cost: approximately USD 120
- Overtime premium: 1 hour × USD 50 = USD 50
- Total cost of a bad day: USD 470
Step 3: Compare That to the Price Difference Per Ton
Return to the original quote. Supplier A’s price advantage was USD 15 per ton. On a 10-ton delivery, the headline saving is USD 150.
One bad day wipes out more than three deliveries’ worth of savings. Two bad days in a month and the “cheaper” supplier becomes the expensive one.
This calculation forms the core of a True Cost of Downtime model. Picture an iceberg: the price per ton sits above the waterline, small and visible. Beneath the surface lurk waste, downtime, overtime, complaints, and lost orders, a mass far larger than the tip suggests.
Practical Steps to Reduce Variance Without Overpaying
Rejecting low-cost options entirely isn’t the answer. The goal is reducing risk without always defaulting to the most expensive grade.
Clarify the Specs That Matter for Bag Performance
Vague purchase orders invite interpretation. Define minimum acceptable values for the properties that affect runnability and finished bag strength:
- GSM (basis weight): Directly affects bag stiffness and machine handling.
- Burst Factor: Indicates resistance to puncture and pressure.
- Moisture content: Paper is a hygroscopic material, meaning it naturally absorbs and releases moisture from its environment. This well-established property is the cause of dimensional changes, which often lead to curl, deformation, and unstable reel running. Controlling moisture within a stable range prevents these problems.
- Consistency: Variation within a roll or between rolls causes constant adjustment.
Tightening these specifications gives procurement a clear benchmark and gives suppliers less room to substitute marginal stock. For a deeper look at how these properties interact, understanding GSM and burst factor specifications provides detailed context on predicting bag strength.
Shortlist Suppliers Based on Process Control, Not Just Price
Price reveals what a supplier charges. Process control predicts what they’ll deliver.
Look for signals that a supplier manages variance at the source:
- Documented moisture control during production and storage
- QC checks with test certificates available per shipment
- Consistent roll profiles and packaging that protects against transit damage
Verified suppliers with transparent quality data reduce the guesswork. Unknown stock lots may offer attractive prices but carry higher odds of feeding the hidden cost buckets described above. When exploring kraft paper suppliers, filtering by verified status and grade capability helps narrow the field before price comparisons begin.
Pilot Orders and “Bad Batch” Reviews
Before committing volume, run a small trial. Track three metrics against your current supplier:
- Waste percentage
- Downtime events
- Customer complaints or internal rejections
If the trial performs well, scale gradually. If problems emerge, the loss stays contained. Use a systematic supplier verification checklist to evaluate new sources before committing to volume orders. Building a simple “bad batch review” routine, a 15-minute debrief after any problematic delivery, turns isolated incidents into data that informs future sourcing decisions.
Aligning Owners and Ops on “Acceptable Risk” for Kraft Specs
The tension between cost and quality often plays out as a debate between two perspectives that rarely share the same data.
Owner’s View: Cost Per Ton and Working Capital
From the owner’s seat, kraft paper is a line item on the P&L and stock on the balance sheet. Lower cost per ton improves gross margin. Smaller orders free up working capital. The pressure to bring down COGS is real, especially when customers push for lower bag prices.
A quote showing USD 15 per ton savings looks like relief.
Ops View: Runnability, Scrap, and Complaints
From the plant floor, paper quality determines how the day goes. Stable rolls mean steady output. Inconsistent stock means chasing jams, cleaning adhesive build-up, rethreading webs, and fielding calls from unhappy customers.
The ops manager remembers the last time “cheaper” paper arrived. The owner may not.
Using a Simple Cost-of-Downtime Model to Find Common Ground
Rather than arguing, use plant data. A short monthly review comparing suppliers on a one-page scorecard can settle debates:
- Price per ton
- Waste percentage vs previous month
- Downtime events attributed to paper quality
- Complaint or return rate
- Net margin impact using the True Cost model
When the conversation shifts from opinions to evidence from your own machines, alignment between owner and operations prioritiesbecomes easier. The calculator isn’t just a spreadsheet. It’s a conversation tool that turns cost-versus-quality friction into shared decision-making.
Consensus checklist for evaluating a new supplier:
- Waste % compared to current supplier
- Downtime events per month
- Complaint rate from customers or internal QA
- Price difference per ton
- Net impact calculated through the True Cost model
Protecting Margins Starts with Taking Paper Quality Seriously
The myth is simple: shave a few dollars off the price per ton and margins improve. The reality is messier. Variance in strength and moisture converts that apparent saving into scrap, stoppages, overtime, and strained customer relationships.
Cheap on paper. Expensive in practice.
The good news is that avoiding this trap doesn’t require expensive consultants or complex procurement systems. It requires a shift in mindset, from lowest quote to total cost of ownership, and a simple model that both owners and operations managers can use together.
With that model in hand, evaluating a new supplier becomes less of a gamble. You can test offers before betting the plant on them. You can sleep a little better knowing that a modest premium on reliable paper protects against losses far larger than the savings ever promised.
If you’re rethinking how you evaluate offers, the grade selection guide for kraft paper used in bags offers a deeper view of quality, specifications, and sourcing strategy.
For plants that struggle with MOQs alongside quality concerns, sourcing low-MOQ kraft paper without compromising quality addresses both challenges together.
Disclaimer: This guide shares general principles for evaluating kraft paper quality and its impact on production margins. Every plant operates with unique machines, grades, and customer requirements, so treat the numbers in this article as examples only and validate them against your own data before making sourcing decisions.
Our Editorial Process:
Our expert team uses AI tools to help organize and structure our initial drafts. Every piece is then extensively rewritten, fact-checked, and enriched with first-hand insights and experiences by expert humans on our Insights Team to ensure accuracy and clarity.
About the PaperIndex Insights Team
The PaperIndex Insights Team is our dedicated engine for synthesizing complex topics into clear, helpful guides. While our content is thoroughly reviewed for clarity and accuracy, it is for informational purposes and should not replace professional advice.